
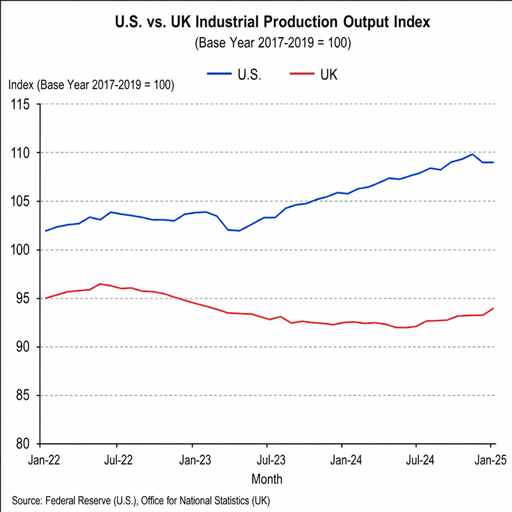
Industrial production output is showing a split picture in the latest official data: U.S. industrial production was flat in August 2026, while UK production posted a small monthly rise in July but remained weaker over the latest three-month period. The figures point to uneven manufacturing output growth rather than a broad industrial acceleration, with utilities, electronics, pharmaceuticals and selected equipment categories doing much of the work. For businesses tracking manufacturing sector trends, the practical takeaway is clear: output is not collapsing, but momentum is narrow and still vulnerable to revisions.
What does the latest industrial production data show?
The latest U.S. industrial production data from the Federal Reserve showed total industrial production unchanged in August 2026 after a 0.2% gain in July. Manufacturing output fell 0.3% in August, while mining edged up 0.1% and utilities rose 1.8%, leaving the total industrial production output index at 103.1% of its 2017 average and 1.4% above its year-earlier level. Capacity utilization held at 76.3%, still 3.1 percentage points below its long-run average for 1972 through 2025.
In the UK, the Office for National Statistics reported that monthly production output increased by 0.2% in July 2026, following declines in June and May. That monthly improvement was helped by manufacturing, which rose 0.9%, and water supply and sewerage, which rose 2.0%; mining and quarrying, along with electricity and gas, partly offset those gains. Over the three months to July 2026, however, UK production output fell 0.5%, even as manufacturing output grew 0.5% over the same comparison period.
The headline numbers point to narrow momentum
The U.S. data show a pause after several months of modest gains. The total index rose from 101.7 in March 2026 to 103.1 in August, but the August monthly reading itself was flat, and the manufacturing index slipped from 98.4 in July to 98.2 in August. That makes the latest report less a signal of broad industrial weakness than a reminder that manufacturing growth has not yet turned into a consistent, economy-wide production upswing.
Market-group detail reinforces that mixed message. Business equipment was still 7.1% above its year-earlier level in August, but it fell 0.5% on the month; consumer goods rose 0.1% on the month but remained 1.1% below August 2025. Construction supplies dropped 0.7% in August, while materials rose 0.2%, suggesting firms are still seeing differentiated demand across capital goods, household demand and input-heavy industrial categories.
The UK pattern is similar in spirit, though not identical in timing. Production output improved in July, but the broader three-month reading was negative because gains in manufacturing were outweighed by contractions in water supply, electricity and gas, and mining and quarrying. Within manufacturing, seven of 13 subsectors increased in the three months to July, led by computer, electronic and optical products, machinery and equipment, and food products, beverages and tobacco.
Key data points from the latest releases
- U.S. total industrial production: unchanged in August 2026 after rising 0.2% in July; the total index stood at 103.1, using 2017 as the base year.
- U.S. manufacturing output: down 0.3% in August, though still 0.9% above its August 2025 level.
- U.S. capacity utilization: steady at 76.3%, below the 1972–2025 average, which signals remaining slack in industrial capacity.
- UK production output: up 0.2% in July 2026, after falls of 0.2% in June and 0.7% in May.
- UK manufacturing output: up 0.9% in July, with eight of 13 manufacturing subsectors increasing on the month.
- UK three-month production trend: down 0.5% in the three months to July, despite a 0.5% three-month rise in manufacturing.
Manufacturing remains the swing factor
Manufacturing matters because it is often the most closely watched component of industrial production output. It connects demand for consumer goods, business investment, exports, inventories, energy consumption and raw-material use. When manufacturing output growth is broad, it can suggest that factories are receiving stronger orders and using more capacity; when growth is limited to a few subsectors, the signal is more cautious.
In the U.S., the August decline in manufacturing output came after modest gains earlier in the summer. The Federal Reserve’s definition of the industrial sector includes manufacturing, mining, and electric and gas utilities, with manufacturing covering NAICS manufacturing industries plus several historically included categories such as logging and certain publishing activities. That definition matters because a flat headline number can hide offsetting movements between factories, energy producers and utilities.
In the UK, the manufacturing figures looked better than the overall production sector in July. The largest monthly positive contribution came from computer, electronic and optical products, which rose 5.2%; basic pharmaceutical products and pharmaceutical preparations rose 3.4%; and basic metals rose 2.8%. Those gains helped offset weakness elsewhere, including mining and quarrying and electricity and gas in the wider production category.
Why the data matters for business planning
Industrial production data is not just a macroeconomic headline. Manufacturers, suppliers, logistics providers, investors and policymakers use it to understand whether real output is expanding, stalling or contracting. Because the figures are adjusted for price changes, they provide a clearer read on physical production trends than sales values alone.
For procurement teams, the latest readings argue for caution rather than panic. A flat U.S. headline and a mixed UK release suggest that demand is uneven by category, so blanket assumptions about either shortage or oversupply may be risky. Buyers may need to monitor subsector-level data, especially in electronics, pharmaceuticals, energy-linked industries and construction-related supplies.
For manufacturers, capacity utilization deserves particular attention. The U.S. utilization rate of 76.3% implies that industrial firms, in aggregate, are not running near historical full pressure. That can reduce urgency for large-scale capacity expansion in some industries, although strong pockets such as business equipment or technology-linked production may still require targeted investment.
For market analysts, the revisions calendar is also important. The Federal Reserve’s G.17 release schedule lists the next 2026 releases for October 16, November 17 and December 16, with an annual revision scheduled for November 24. That means today’s reading should be treated as an important signal, not a final verdict on the year’s industrial trajectory.
UK output adds context to global manufacturing sector trends
The UK data show how a national economy can grow even when production is soft. The ONS estimated that real GDP grew 0.4% in the three months to July 2026, with services growing 0.6%, while production and construction each fell 0.5%. In the month of July alone, GDP grew 0.4%, with services, production and construction all contributing positively, but services remained the main driver.
That sector split is essential for interpreting manufacturing sector trends. In advanced economies, industrial output is still economically significant, but it no longer dominates total output in the way it did during earlier phases of industrialization. The House of Commons Library noted that UK manufacturing accounted for 8.3% of total UK economic output, measured by gross value added, from April to June 2026.
The result is a more nuanced picture than a simple “factory boom” or “factory slump.” Industrial production can be weak while headline GDP expands, particularly when services are strong. Conversely, a manufacturing rebound can improve the production sector without necessarily reshaping the whole economy unless it is large, sustained and spread across many subsectors.
The Industrial Revolution benchmark still shapes how output is read
Modern industrial production output data is built around indexes, capacity measures and month-to-month changes, but the underlying question is old: how do economies increase production output during the Industrial Revolution and after it? The historic answer was a mix of mechanization, new power sources, factory organization, improved transport and expanding markets. The Bank of England describes the Industrial Revolution, beginning around the middle of the 18th century, as an era associated with the steam engine, cotton spinning and railways.
That history is especially visible in British textile production output during the Industrial Revolution. Researchers studying cotton spinning have found that yarn output per worker rose sharply over time, with estimates moving from hundreds of pounds per worker in the late 1780s to much higher levels by the mid-19th century. A British textile production output industrial revolution chart typically shows exactly that kind of transformation: output growth was not only about more workers, but also about machines, process improvements and rising output per worker.
A Bank of England-hosted presentation on technological progress summarized cotton textiles as one of the fastest-productivity-growth sectors of the period, with mechanization, the factory system, water power and steam power changing production. It reported cotton-textile output growth rates of 7.3% per year from 1760 to 1800, 5.3% from 1800 to 1830 and 5.0% from 1830 to 1860, while productivity growth accelerated across those periods.
The comparison is useful, but it has limits. Today’s manufacturing output growth is measured in mature, diversified economies with complex supply chains, services-heavy GDP and tight statistical revisions. Industrial Revolution-era British textile production output was a sectoral transformation inside an economy moving toward mechanized production. The lesson is not that modern factories should expect 18th-century-style growth; it is that sustained output gains usually require technology adoption, capital investment, workforce adaptation and demand growth to reinforce one another.
What happens next
The next round of industrial production data will determine whether the latest flat U.S. reading was a pause or the start of softer factory momentum. Analysts will be watching whether manufacturing output returns to growth, whether utilities normalize after the August increase, and whether business equipment remains one of the stronger year-over-year categories. The Federal Reserve’s October 16 release is the next key date for U.S. industrial production output.
In the UK, the next GDP and production updates will matter because the ONS has already flagged that early estimates can be revised as more responses and source data arrive. The agency stated that the next release would open the full time series for revision and include Blue Book 2026-related changes, making upcoming figures especially important for anyone comparing recent manufacturing output growth against longer-term trends.
For now, the latest industrial production data supports a cautious reading: factories are not moving in one direction everywhere at once. The strongest signal is dispersion. Some subsectors are expanding, others are dragging, and the headline numbers remain sensitive to energy, utilities, mining and revisions as much as to factory-floor demand itself.
