
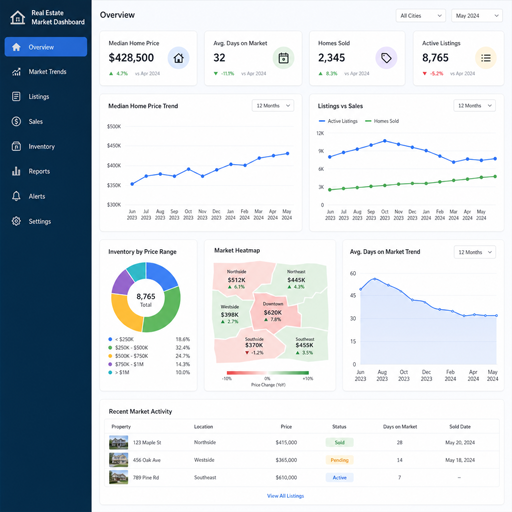
Housing market activity indicators are the data points that show how quickly homes are being listed, viewed, financed, negotiated, sold, or withdrawn from the market. They help investors, lenders, proptech teams, analysts, and real estate professionals move beyond headlines and understand what is actually happening inside a property market. Used together, these indicators turn scattered signals into practical market insights for pricing, forecasting, acquisition strategy, and risk management.
What do housing market activity indicators measure?
Housing market activity indicators measure the movement and behavior behind residential real estate supply and demand. Instead of looking only at prices, they show whether buyers are active, sellers are confident, inventory is tightening, financing conditions are changing, or transactions are slowing. In short, they help explain the “why” behind visible market trends.
A healthy market analysis usually combines several categories of indicators because no single metric tells the full story. Rising prices may look positive, for example, but if sales volume is falling and listings are sitting longer, the market may be losing momentum. Likewise, a jump in inventory can signal more buyer choice, seller urgency, seasonal listing patterns, or weakening demand depending on the surrounding data.
Core activity indicators that shape market analysis
The most useful housing market indicators fall into groups: supply, demand, pricing, speed, financing, and transaction outcomes. Each group answers a different question about the property market, and the strongest insights come from reading them together.
Listing volume and new inventory
New listings show how many properties are entering the market within a defined period. When new inventory rises, buyers may have more choice and sellers may face more competition. When it falls, supply can tighten, especially if buyer demand remains steady.
Analysts often compare new listings with active listings. New listings show fresh supply, while active listings show the total pool available to buyers. If new listings are stable but active inventory is rising, homes may be taking longer to sell.
Sales volume and closed transactions
Sales volume tracks completed transactions and is one of the clearest measures of market liquidity. Higher sales volume usually suggests active buyer participation and functioning price discovery. Lower volume may point to affordability pressure, weak confidence, limited inventory, or a gap between buyer and seller expectations.
Closed sales are useful, but they are often a lagging indicator because they reflect deals agreed weeks earlier. For faster market insights, many analysts also monitor pending sales, contract activity, showing activity, and listing status changes.
Days on market and absorption rate
Days on market measures how long properties take to sell. Shorter times can indicate strong demand, attractive pricing, or limited supply. Longer times may suggest overpricing, weaker buyer urgency, or a shift toward more negotiating power for buyers.
Absorption rate estimates how quickly available inventory would sell at the current pace of transactions. It is especially useful for comparing local submarkets because two areas can have similar prices but very different levels of buyer activity.
Price movement and price reductions
Median sale price, list price, price per square foot, and sale-to-list ratio all help explain pricing direction. However, price trends should be interpreted carefully because the mix of homes sold can change from month to month. A higher median price does not always mean every home is appreciating.
Price reductions add another layer. When more sellers cut asking prices, it may indicate that expectations are ahead of buyer willingness or purchasing power. A low rate of reductions can suggest seller confidence, tight inventory, or competitive demand.
Why do these indicators matter for real estate trends?
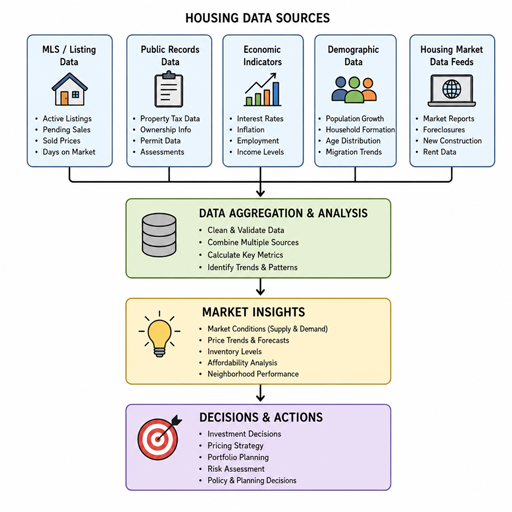
These indicators matter because real estate trends usually appear in activity data before they become obvious in final prices. By tracking supply, demand, speed, and negotiation signals, decision-makers can identify turning points earlier and avoid relying on stale assumptions. Activity data helps turn market commentary into evidence-based judgment.
For real estate professionals, this means better pricing conversations and more realistic seller guidance. For investors, it supports market selection, acquisition timing, and risk screening. For lenders and fintech teams, it can improve portfolio monitoring, collateral analysis, and local market awareness.
Key practical uses include:
- Pricing strategy: Compare list prices, sale prices, reductions, and days on market to set realistic expectations.
- Market entry decisions: Identify areas with improving liquidity, constrained supply, or emerging buyer demand.
- Risk monitoring: Watch for rising inventory, slower absorption, or falling transaction activity.
- Lead prioritization: Focus outreach where listings are active, owners are adjusting prices, or buyer demand is strong.
- Forecasting support: Combine recent activity indicators with economic, demographic, and financing data.
Reading supply and demand together
Supply and demand indicators are most valuable when viewed as relationships rather than isolated numbers. A rise in listings is not automatically negative; it can support more transactions if demand is also increasing. A decline in sales is not automatically bearish if there are simply fewer homes available to buy.
A simple framework can help:
|
Market signal |
Possible interpretation |
What to check next |
|---|---|---|
|
Inventory rising, sales falling |
Demand may be softening |
Price reductions, days on market, mortgage conditions |
|
Inventory falling, sales steady |
Supply may be tight |
New listings, buyer competition, sale-to-list ratio |
|
Listings rising, sales rising |
Market activity may be expanding |
Absorption rate, pending sales, local job trends |
|
Prices rising, volume falling |
Affordability or supply constraints may be present |
Buyer income, loan rates, inventory mix |
This approach prevents overreacting to a single headline number. The goal is not to find one perfect metric, but to build a consistent interpretation from multiple signals.
How can a housing market indicators API improve decisions?
A housing market indicators API can make market analysis faster, more consistent, and easier to scale. Instead of manually collecting data from separate reports or portals, teams can feed structured housing market indicators into dashboards, models, alerts, and internal workflows. This is especially useful when monitoring many cities, ZIP codes, property types, or investment markets at once.
An API-driven workflow can support both strategic and operational use cases. Executives may use it to compare market trends across regions, while analysts may use it to test acquisition assumptions. Product teams can also use market indicators inside customer-facing tools, property valuation features, or investor portals.
When evaluating any housing market indicators api, consider whether it supports:
- Geographic granularity at the market, neighborhood, ZIP code, or parcel-relevant level.
- Historical depth for trend comparison, seasonality checks, and model training.
- Update frequency that matches the speed of your decisions.
- Consistent definitions for listings, sales, pending activity, and price metrics.
- Reliable coverage across the locations and property types you actually analyze.
- Documentation and usability so technical and nontechnical teams can understand the data.
Common mistakes when interpreting market indicators
Even strong data can lead to weak conclusions if it is used without context. Housing markets are local, seasonal, and sensitive to financing conditions, so interpretation should be disciplined.
One common mistake is treating national trends as local truth. A national slowdown may hide strong activity in specific metros, and a hot regional market may contain weaker submarkets. Another mistake is comparing raw monthly figures without considering seasonality. Many property market metrics naturally rise or fall during certain parts of the year.
Avoid these errors:
- Using price alone as the market signal. Prices can lag activity and can be distorted by the mix of homes sold.
- Ignoring inventory quality. More listings do not help buyers if the homes are poorly located, overpriced, or mismatched to demand.
- Overreading short-term noise. Weekly or monthly changes may reflect holidays, weather, reporting delays, or small sample sizes.
- Forgetting financing pressure. Buyer activity can shift quickly when borrowing costs or credit conditions change.
- Comparing unlike markets. A downtown condo market and a suburban single-family market may move differently.
Building a practical indicator framework
A useful framework starts with the decision you need to make. A broker advising a seller, an investor choosing a market, and a lender monitoring collateral risk may all use similar indicators, but they will weigh them differently. The best frameworks are focused, repeatable, and easy to explain.
Start by defining the market area and property segment. Then choose a small set of primary indicators, such as new listings, active inventory, pending sales, closed sales, median price, days on market, price reductions, and absorption rate. Finally, review them on a consistent schedule so changes can be measured against prior periods rather than judged in isolation.
A practical review process might look like this:
- Establish the baseline: Compare current indicators with the previous month, previous quarter, and same period last year.
- Separate supply from demand: Identify whether changes are driven by listings, buyers, or both.
- Check speed and negotiation signals: Review days on market, sale-to-list ratio, and price reductions.
- Look for local variation: Break the market into neighborhoods, price bands, or property types.
- Document the conclusion: Record what changed, what likely caused it, and what action should follow.
Turning indicators into market insights
Housing market activity indicators are most powerful when they lead to a clear decision. A dashboard full of charts is not the same as insight. Insight explains what changed, why it matters, and what a person or team should do next.
For example, if inventory is rising while price reductions increase and sales volume declines, the practical takeaway may be to price listings more conservatively or underwrite acquisitions with more caution. If new listings remain low while homes sell quickly and sale-to-list ratios are firm, the market may still favor sellers despite broader uncertainty.
The strongest real estate trends analysis blends data with context. Local employment, population movement, construction pipeline, lending conditions, and buyer affordability can all shape how indicators should be interpreted. Activity indicators provide the market’s pulse; broader context explains the pressure behind it.
A better way to understand the property market
Housing market indicators give professionals a clearer view of movement, momentum, and risk in the property market. By combining inventory, sales, pricing, speed, and financing signals, teams can identify changing conditions earlier and make decisions with more confidence.
Whether used in a spreadsheet, dashboard, valuation model, or housing market indicators API, the goal is the same: convert real estate activity into practical market insights. The more consistently those indicators are tracked and interpreted, the easier it becomes to understand where a market has been, where it may be heading, and what action makes sense now.
