
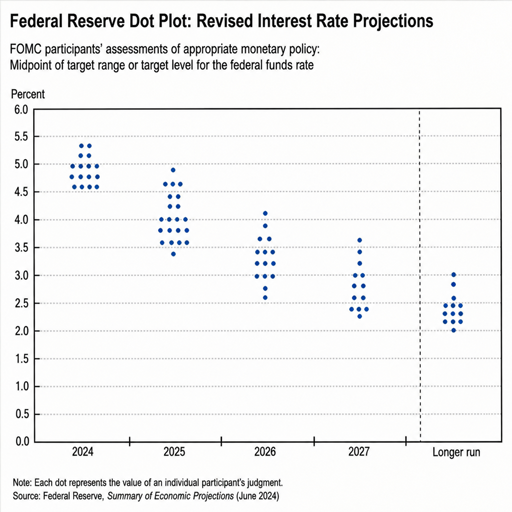
The Federal Reserve’s latest dot plot revisions point to a firmer path for fed interest rates than policymakers projected earlier in 2026. In the September Summary of Economic Projections, FOMC participants lifted their median federal funds rate estimates for 2026, 2027 and 2028, while also marking down unemployment expectations and leaving inflation above target in the near term. The revisions give investors, lenders and households a clearer view of how officials are weighing persistent inflation against a labor market that appears stronger than previously expected.
What changed in the Fed dot plot?
The main change is that the federal reserve dot plot moved higher across the visible policy horizon. The median projected federal funds rate rose to 4.1% for the end of 2026, 4.1% for 2027 and 3.9% for 2028, compared with June projections of 3.8%, 3.6% and 3.4%, respectively. The September release also introduced a 2029 median projection of 3.6% and nudged the longer-run estimate to 3.2%, slightly above June’s 3.1% longer-run median.
Those numbers matter because the fed dot plot is one of the market’s most closely watched guides to interest rate projections. It is not a promise or a preset policy path, but it shows where individual Federal Reserve Board members and Reserve Bank presidents think the policy rate should stand at year-end if the economy develops as they expect. In plain terms, September’s dots suggest officials see less room for near-term easing than they did at midyear.
The latest projections show rates staying higher for longer
The September projections arrived alongside a policy decision that raised the target range for the federal funds rate by a quarter point to 3.75% to 4.00%. That move made the revised dot plot especially important: officials were not only changing current fed interest rates, they were also signaling that the expected path ahead had shifted upward.
A concise comparison of the median projections shows the scale of the revision:
|
Projection year |
March 2026 median |
June 2026 median |
September 2026 median |
|---|---|---|---|
|
2026 federal funds rate |
3.4% |
3.8% |
4.1% |
|
2027 federal funds rate |
3.1% |
3.6% |
4.1% |
|
2028 federal funds rate |
3.1% |
3.4% |
3.9% |
|
Longer-run federal funds rate |
3.1% |
3.1% |
3.2% |
The federal reserve dot plot march 2026 release had shown a gentler policy path, with the median federal funds rate at 3.4% for 2026 and 3.1% for both 2027 and 2028. By June, those medians had already moved up as inflation expectations worsened. September extended that shift, turning what had looked like a gradual return toward lower rates into a more prolonged plateau.
Economic forecasts reshaped the rate outlook
The higher interest rate projections were accompanied by changes in the Fed’s economic forecasts. In September, the median real GDP growth estimate increased to 2.3% for 2026 and 2.4% for 2027, up from June’s 2.2% and 2.3%. The unemployment rate outlook moved lower, with the median estimate falling to 4.1% for 2026, 2027 and 2028, compared with June readings of 4.3%, 4.3% and 4.2%.
Inflation remains the sticking point. The September median PCE inflation estimate for 2026 rose to 3.7%, slightly above June’s 3.6%, while the 2027 estimate stayed at 2.3%. Core PCE inflation, which excludes food and energy, was marked at 3.4% for 2026 and 2.5% for 2027, suggesting policymakers still do not expect underlying inflation to return quickly to the Fed’s 2% goal.
That mix helps explain the dot plot revisions. Stronger growth and lower unemployment can reduce the urgency to cut rates, while elevated inflation can increase pressure to keep policy restrictive. The September projections therefore point to an FOMC that sees the economy as resilient enough to withstand higher rates, at least under the assumptions participants used when submitting their forecasts.
March’s dot plot now looks like the low point for 2026 expectations
The March 2026 dot plot was notable because it largely maintained expectations for eventual rate declines. At that meeting, policymakers projected median GDP growth of 2.4% in 2026, unemployment of 4.4%, PCE inflation of 2.7% and core PCE inflation of 2.7%. The median federal funds rate path sat at 3.4% for 2026 and 3.1% for the following two years, implying a policy rate drifting closer to the longer-run estimate.
By June, that picture had changed. The 2026 median PCE inflation projection jumped from 2.7% in March to 3.6%, and core PCE inflation rose from 2.7% to 3.3%. The median policy-rate projection moved higher at the same time, to 3.8% for 2026 and 3.6% for 2027.
September then reinforced the direction of travel. It showed slightly higher inflation for 2026, lower unemployment and a higher rate path through 2028. For readers tracking interest rate trends, the sequence from March to June to September is the story: the Fed’s baseline moved from cautious normalization toward a more restrictive stance lasting longer than previously expected.
Market and borrower implications are broader than one meeting
The dot plot does not directly set mortgage rates, credit card APRs, auto loan terms or Treasury yields. Those rates also reflect inflation data, bond-market supply and demand, credit risk, investor expectations and lender pricing. Still, the federal reserve dot plot can influence financial conditions because markets often reprice when the projected policy path shifts.
A higher-for-longer dot plot can affect several areas:
- Bond yields: Treasury yields may adjust if investors believe the Fed will keep short-term rates elevated for longer than previously expected.
- Mortgage and consumer credit: Lenders may price loans more cautiously when benchmark rate expectations move up.
- Business investment: Companies facing floating-rate debt or refinancing needs may revisit capital spending plans.
- Equity valuations: Higher discount rates can pressure valuations, especially for companies whose expected cash flows are farther in the future.
- Savings products: Bank deposits, money market funds and short-term Treasury products may remain more competitive if policy rates stay elevated.
The practical takeaway is not that every borrowing cost will rise immediately by the same amount. It is that the Fed’s published interest rate projections have shifted the expected backdrop. Households planning major purchases and businesses managing debt should treat the dot plot as a risk signal, not as a guaranteed rate schedule.
Policymakers remain divided, but the center has shifted
The September dot distribution shows most participants clustered around a 2026 federal funds rate midpoint of 4.125%, with four participants at 4.375% and two at 3.875%. For 2027, the dots were more spread out, including eight participants at 4.375%, six at 4.125%, three at 3.625% and one at 3.125%. That dispersion shows there is still disagreement over how restrictive policy should remain after 2026.
The longer-run projections also show a wide range, from 2.875% to 3.875%. That matters because the longer-run rate is often read as a rough estimate of neutral policy, or the level that neither stimulates nor restrains the economy over time. A higher longer-run median, even by one-tenth of a percentage point, can influence how investors interpret the endpoint of the Fed’s cycle.
The Fed itself cautions against reading the dot plot as a firm forecast. Its projection materials state that federal funds rate projections reflect each participant’s assessment of appropriate monetary policy, and the path can change when economic conditions change. The Fed also notes that the outlook for the funds rate is subject to considerable uncertainty because policy depends on the evolution of real activity and inflation.
What happens next
The next phase for markets will depend on whether incoming inflation and labor-market data confirm the September assumptions. If inflation cools faster than expected or growth weakens, future dot plot revisions could move lower. If inflation remains sticky while unemployment stays low, policymakers may continue to project a higher policy path.
For now, the latest federal reserve dot plot shows a clear revision: the median FOMC participant expects fed interest rates to remain above earlier 2026 projections for longer. The March release framed a gradual decline in rates; the September update frames a more durable fight against inflation, supported by economic forecasts that still show growth and a relatively steady labor market.
