
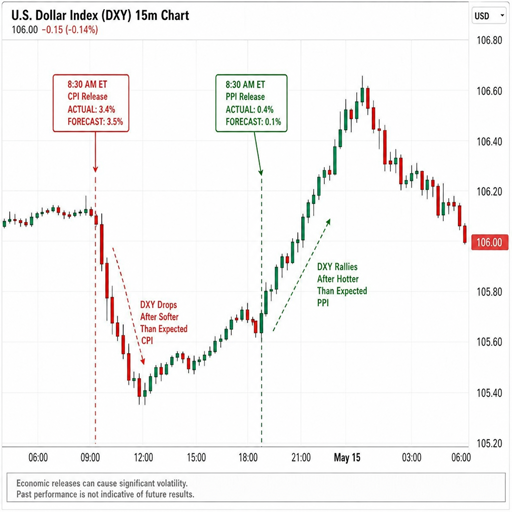
US inflation data is one of the main drivers of short-term moves in the U.S. dollar because it changes what markets expect the Federal Reserve to do next. When inflation runs hotter than expected, traders often price in tighter policy, higher Treasury yields, and a stronger USD; when inflation cools, the opposite can happen. This guide explains how to read US inflation rates, what the latest official data says, and how CPI, PCE, and market expectations flow through to currencies, bonds, and stocks.
Why does US inflation data move the USD?
US inflation data moves the USD because it affects interest-rate expectations, and interest-rate expectations affect the relative return investors can earn by holding dollar-denominated assets. If inflation is sticky, markets may expect the Fed to keep policy tighter for longer, which can support the dollar. If inflation is easing, markets may expect lower rates, which can reduce the dollar’s yield advantage.
The reaction is not automatic, though. The dollar usually responds to the surprise in the data, not just the headline number. A 3.4% annual inflation rate may lift the USD if investors expected 3.2%, but weigh on the USD if investors expected 3.7%. That is why traders compare actual releases with consensus forecasts, prior readings, and the details inside the report.
As of the latest CPI release available on September 25, 2026, the Consumer Price Index for All Urban Consumers rose 0.4% month over month in August and 3.4% year over year before seasonal adjustment; core CPI, which excludes food and energy, rose 0.3% on the month and 2.4% over the year. The next CPI release, covering September 2026, is scheduled for October 14, 2026.
The main inflation indicators behind USD moves
The phrase “US inflation data” can refer to several reports. CPI gets the most immediate market attention because it is timely and widely followed. PCE matters deeply because it is the Federal Reserve’s preferred inflation framework. PPI, wages, import prices, and inflation expectations can also shape the US inflation forecast and the way markets position before official releases.
CPI: the market’s headline inflation report
The Consumer Price Index is often the release traders watch first. It measures changes in prices paid by consumers for goods and services, including categories such as food, shelter, fuels, transportation, medical care, clothing, and other everyday purchases. The CPI-U population represents more than 90% of the U.S. population, making it a broad measure of consumer price pressure.
CPI affects the USD because it arrives with enough detail to change the market’s view of inflation momentum. A strong headline CPI may matter less if the increase is driven by a temporary jump in gasoline. A strong core CPI may matter more because it suggests underlying price pressure is not limited to volatile categories.
PCE: the Fed-focused US price index
The Personal Consumption Expenditures price index is another key US price index. It reflects prices paid for goods and services purchased by people in the United States or on their behalf, and it is designed to capture a broad range of consumer expenses while reflecting changes in consumer behavior. The BEA’s latest PCE page shows July 2026 PCE inflation at 3.7% year over year, with the next release scheduled for September 30, 2026.
For USD analysis, CPI often drives the first move, while PCE can confirm or challenge the bigger policy story. If CPI is hot but PCE is calmer, traders may treat the inflation scare as less durable. If both CPI and PCE are firm, the case for restrictive Fed policy becomes stronger.
Core inflation: the signal beneath the noise
Core inflation strips out food and energy because those prices can swing sharply for reasons unrelated to domestic demand. That does not mean food and energy are unimportant to households. It means policymakers and traders often use core measures to judge whether inflation pressure is spreading through the economy.
In the August 2026 CPI report, gasoline rose 3.9% on the month and accounted for over one-third of the monthly all-items increase, while energy rose 2.1% and shelter rose 0.3%. Those details matter because a gasoline-led CPI surprise may produce a different USD reaction than a broad-based jump in rent, services, and wages.
How inflation surprises transmit into the dollar
Inflation data affects the USD through a chain of expectations. The report changes the market’s inflation view, that view changes expected Fed policy, expected policy changes Treasury yields, and yield changes affect global demand for dollars. The cleaner the chain, the stronger the market reaction tends to be.
A typical transmission path looks like this:
- Inflation release: CPI, PCE, or another US inflation rate data point comes out.
- Surprise assessment: Traders compare actual data with forecasts and prior readings.
- Fed repricing: Rate-cut or rate-hike expectations adjust.
- Yield reaction: Treasury yields rise or fall, especially in the two-year part of the curve.
- USD move: The dollar strengthens if yield support rises relative to other currencies, or weakens if it falls.
- Risk reaction: Stocks, credit, gold, and emerging-market currencies adjust to the new rate and growth outlook.
This is why “hot inflation” can strengthen the USD even when the data is bad news for consumers. Currencies are relative prices. If U.S. yields rise more than German, Japanese, British, or Canadian yields after a CPI release, the dollar can gain even if the inflation report raises concerns about the economy.
Hot, cool, and mixed inflation readings
Not every inflation report sends a simple signal. Markets look at headline CPI, core CPI, month-over-month momentum, year-over-year rates, shelter, services, energy, food, and revisions. The USD reaction depends on which part of the report changes the Fed story most.
|
Inflation outcome |
Typical USD reaction |
Why it happens |
What to check next |
|---|---|---|---|
|
Hot headline and hot core |
USD often rises |
Markets price tighter Fed policy or delayed cuts |
Two-year Treasury yield, Fed funds futures |
|
Hot headline but soft core |
Mixed |
Energy or food may be driving the move |
Gasoline, food, shelter, services detail |
|
Cool headline and cool core |
USD often falls |
Markets price easier policy |
Bond yields, equity response, gold |
|
Cool headline but sticky services |
Choppy |
Inflation is easing, but not where the Fed may care most |
Core services, shelter, wages |
|
In-line data |
Limited or temporary move |
Positioning matters more than the number |
Prior market bias and USD trend |
The phrase “US stocks fall sharply due to hot inflation data” describes a common risk-off setup: inflation surprises higher, yields jump, equity valuations come under pressure, and the dollar can strengthen as investors seek yield or safety. But this is a scenario, not a rule. If hot inflation raises stagflation fears or damages confidence in U.S. assets, the USD response can be less straightforward.
The Fed reaction function is the bridge
The dollar does not respond to inflation in isolation. It responds to how inflation changes the likely path of monetary policy. The Federal Reserve’s Summary of Economic Projections from June 2026 showed policymakers’ median projection for PCE inflation at 3.6% in 2026 and 2.3% in 2027, with core PCE inflation projected at 3.3% in 2026 and 2.5% in 2027. The same table showed the projected federal funds rate path, which is the direct policy channel currency markets care about.
This matters because a hotter US inflation forecast can support the USD only if markets believe the Fed will respond with tighter policy. If inflation is high but growth is weakening quickly, traders may debate whether the Fed can keep rates high. In that case, the dollar may initially rise on yields, then reverse if recession risk dominates.
The Fed’s July 2026 Monetary Policy Report described inflation as having trended up and then stepped higher in spring, with total PCE inflation at 4.1% over the 12 months ending in May and core PCE at 3.4%. It cited factors including tariffs, energy prices related to oil-supply constraints, and demand for some high-tech products.
What traders mean by “US inflation data today”
When traders search for “US inflation data today,” they usually want to know three things: the latest official release, whether it beat or missed expectations, and how markets reacted. The important point is that “today” changes quickly. On September 25, 2026, the latest official CPI release is the August 2026 report published on September 11, while the next PCE update is scheduled for September 30 and the next CPI update for October 14.
A practical inflation-release checklist includes:
- Actual vs forecast: Did CPI or PCE come in above, below, or in line with expectations?
- Monthly pace: Is the one-month change accelerating or cooling?
- Core trend: Are underlying prices still firm after excluding food and energy?
- Breadth: Is inflation concentrated in energy, or spread across services and shelter?
- Revisions: Did prior data change the trend?
- Fed context: Does the release arrive before a major policy meeting?
- Market positioning: Was the USD already priced for a hot or cool number?
This checklist helps avoid a common mistake: reacting only to the headline year-over-year number. The annual rate is useful, but the market often cares more about the fresh monthly pace because it shows where inflation may be going next.
Why the same inflation number can produce different USD moves
A single US inflation data point can push the dollar in different directions depending on the macro backdrop. If the U.S. economy is resilient and inflation is firm, hot data can be USD-positive because tighter policy looks credible. If growth is fragile, hot inflation can create a stagflation concern, making the market less willing to buy U.S. assets.
Global context also matters. The USD is traded against other currencies, not in a vacuum. A hot U.S. CPI report may boost USD/JPY if U.S. yields rise while Japanese yields stay anchored. The same report may have a smaller impact on EUR/USD if euro-area inflation is also surprising higher and European yields are moving in the same direction.
Positioning can overwhelm the textbook reaction. If traders are already heavily long USD before the release, even a hot number may trigger profit-taking. If traders are short USD and inflation surprises higher, the move can be sharper because investors rush to cover positions.
CPI categories that matter most for USD analysis
The CPI table contains many categories, but not all carry the same market weight. Traders focus on the parts that reveal persistence. Energy can move the headline. Shelter and services can shape the core trend. Goods prices can show whether supply chains, tariffs, or import costs are passing through.
Shelter
Shelter is important because it has a large weight in CPI and tends to move slowly. A sustained shelter slowdown can support the case for disinflation. A reacceleration can keep core inflation sticky even if goods prices are calm.
Services
Services inflation is closely watched because it can be tied to wages and domestic demand. When services prices keep rising, markets may assume inflation will not fall quickly. That can keep rate expectations elevated and support the USD.
Energy
Energy affects the headline and household sentiment. In August 2026, energy was a major contributor to the monthly CPI increase, with gasoline up sharply on the month and energy up 16.3% over the year. That makes it essential to separate fuel-driven inflation from broader core pressure.
Goods
Goods inflation can reflect supply constraints, exchange rates, tariffs, and consumer demand. A renewed rise in goods prices may be important if it appears alongside services inflation. If goods are stable while services are firm, the market may view inflation as narrower but still persistent.
Inflation, yields, stocks, and the dollar
Inflation affects multiple asset classes at once. The dollar’s move is often clearest when it aligns with Treasury yields. If CPI is hot and two-year yields rise, the USD frequently receives support. If CPI is soft and yields fall, the dollar often loses support.
Stocks react through a different lens. Higher inflation can hurt equities because it may imply higher discount rates and tighter financial conditions. That is the logic behind market headlines about US stocks falling sharply due to hot inflation data. However, equities can sometimes rise after firm inflation if investors believe nominal growth remains strong or if the data was not as bad as feared.
Gold and crypto can react in mixed ways. Hot inflation may support gold as an inflation hedge, but higher real yields and a stronger USD can pressure it. Crypto may respond to liquidity expectations: tighter policy can be negative, while a weaker dollar and easier policy can be supportive.
How to read a US inflation release like a market analyst
Start with the headline, but do not stop there. A disciplined read separates the first market reaction from the deeper signal. The first reaction may happen in seconds; the more durable move often depends on the details.
Use this sequence:
- Check headline CPI or PCE: Compare month-over-month and year-over-year data with forecasts.
- Check core inflation: Look for whether underlying pressure is rising or easing.
- Scan the drivers: Identify whether shelter, services, energy, food, or goods caused the move.
- Watch yields: Confirm whether Treasury yields agree with the inflation interpretation.
- Compare currencies: See whether USD strength is broad or limited to one pair.
- Listen for Fed repricing: Watch rate futures and Fed commentary after the release.
- Avoid overreading one print: One month can be noisy; a trend is more powerful than a single data point.
This approach turns US inflation rate data into a practical market framework. It also helps separate genuine policy signals from temporary volatility.
Key takeaways for USD watchers
US inflation data matters for the USD because it changes the expected path of Fed policy and U.S. yields. CPI tends to move markets quickly, while PCE helps shape the deeper Fed narrative. Core inflation, shelter, services, and energy details often matter more than the headline alone.
The latest available CPI data shows inflation still above the Fed’s longer-run comfort zone, with August 2026 CPI up 3.4% year over year and core CPI up 2.4%. The Fed’s June projections also showed elevated 2026 PCE and core PCE inflation, reinforcing why every new release can shift USD pricing.
For traders and investors, the best question is not simply whether inflation is high or low. The better question is whether the new data changes the US inflation forecast, the Fed path, and the relative yield advantage of the dollar. When those three move in the same direction, USD reactions tend to be stronger and more durable.
