
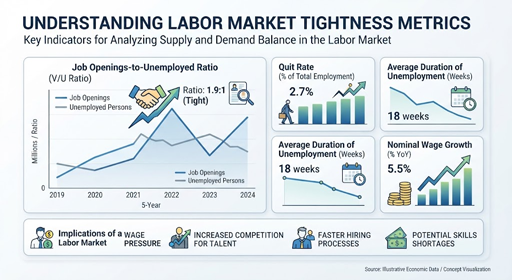
The latest U.S. labor market indicators show a job market that has cooled from the post-pandemic scramble for workers, but has not broken into a broad layoff cycle. New federal data put job openings at 7.1 million in August, while September payroll growth slowed to 29,000 and unemployment held at 4.2 percent. For employers, workers, and analysts, the key story in labor market tightness metrics is balance: demand is softer, hiring is cautious, and worker leverage varies sharply by sector and geography.
What do the latest labor market tightness metrics show?
The newest readings show a labor market that is close to equilibrium by several common measures, rather than one defined by acute shortages or widespread job loss. The Bureau of Labor Statistics reported that job openings were little changed at 7.1 million in August, the openings rate stood at 4.3 percent, hires were 5.2 million, and total separations were 5.1 million. In September, unemployment remained within a narrow 4.1 percent to 4.3 percent range that has held since March, suggesting that the labor market has cooled without a sharp deterioration in employment.
That combination matters because labor market tightness is not captured by one headline figure. A low unemployment rate can still coexist with slower hiring, longer job searches, or fewer attractive openings. A high number of vacancies can also overstate opportunity if postings are concentrated in certain industries, require specialized skills, or remain open without quick hiring. The most useful labor force analysis therefore compares openings, hires, quits, layoffs, participation, wages, and local job seeker behavior.
Key metrics point to cooling demand, not a hiring collapse
The August JOLTS report offered the clearest snapshot of employer demand. Total openings fell by 256,000 from July to August, according to the seasonally adjusted table, while the headline release characterized openings as little changed at 7.1 million. Health care and social assistance still had 1.36 million openings, professional and business services had 1.19 million, and leisure and hospitality had 829,000, showing that demand remains uneven across major industries.
Hires, however, tell a more restrained story. BLS reported 5.2 million hires in August, with a 3.3 percent hires rate, and most major industries showing limited movement. Hiring was not collapsing, but it was no longer keeping pace with the urgency seen when employers were competing aggressively for scarce workers.
The quits rate is another important signal. Quits are voluntary separations, and BLS notes that the quits rate can serve as a measure of workers’ willingness or ability to leave jobs. In August, quits were 3.1 million and the quits rate was 1.9 percent, both unchanged from the prior month, indicating that many workers may be less confident about switching jobs than they were during the hottest phase of the labor market.
Layoffs remain the counterweight to that cooling story. BLS reported layoffs and discharges at 1.6 million in August, with a 1.0 percent rate. The Federal Reserve’s July Monetary Policy Report also described layoff activity as muted, noting that initial unemployment claims had moved sideways and that the JOLTS layoff rate had averaged 1.1 percent so far in 2026, similar to its pre-pandemic average.
The dashboard employers and analysts are watching
A tight labor market is usually one in which employers face difficulty filling roles, workers have strong bargaining power, wages face upward pressure, and job seekers can move quickly between opportunities. A loose labor market is the reverse: more applicants per job, weaker worker leverage, slower hiring, and less urgency from employers. Current workforce metrics sit between those extremes.
The most relevant measures now include:
- Openings-to-unemployed ratio: A high ratio signals more available jobs per job seeker; a ratio near one suggests a more balanced market.
- Job openings rate: This shows open positions as a share of employment plus openings, helping compare demand across industries.
- Hires rate: This separates advertised demand from actual employer action.
- Quits rate: A higher quits rate often signals worker confidence and strong outside options.
- Layoffs and discharge rate: This reveals whether cooling is being driven by reduced hiring or active job cuts.
- Labor force participation: Participation shows whether workers are entering, remaining in, or leaving the labor force.
- Wage growth: Pay trends help confirm whether labor shortages are putting pressure on compensation.
- Local job seeker intensity: Applications, clicks, and job searches per posting can reveal tightness that national data may hide.
These measures are most useful together. If openings fall but layoffs stay low, the market may be moving into a low-hire, low-fire pattern. If quits fall while unemployment rises, workers may feel less able to change jobs. If participation improves while job openings soften, employers may face more available applicants even without a surge in unemployment.
Participation and wages add nuance to the headline numbers
The September Employment Situation report showed labor supply was stable. The labor force participation rate was 61.8 percent, and the employment-population ratio was 59.2 percent, both little changed in September and showing little net change since January. Those figures suggest that the cooling in labor market trends is not simply the result of a sudden withdrawal of workers from the labor force.
Wages also point to moderation rather than renewed overheating. Average hourly earnings for all employees on private nonfarm payrolls rose 0.1 percent in September to $37.81 and were up 3.0 percent over the past 12 months. For production and nonsupervisory workers, average hourly earnings rose 0.2 percent to $32.60.
That wage pattern matters for policymakers. Strong wage gains can support household income, but if they outpace productivity and feed inflation, they can complicate interest-rate decisions. Slower wage growth, paired with stable unemployment, gives a different signal: employers are not bidding as aggressively for labor, but they are not cutting workers broadly either.
Tightness differs by industry and location
National averages can hide large differences in the lived job market. A software worker in a tech-heavy metro may face a very different search than a nurse, construction specialist, restaurant manager, machinist, or public-sector employee. That is why real-time and local data have become more important in labor market analysis.
Indeed Hiring Lab recently introduced a labor market tightness measure covering more than 800 U.S. metropolitan and micropolitan areas. The measure incorporates job seeker interest per posting, search intensity, hiring concentration across employers and occupations, and employer promotion of openings, including paid postings and remote-work signals. Indeed’s analysis found that some of the slackest markets in spring 2026 were in California and the Southeast, though for different reasons: tech-heavy parts of California reflected weaker labor demand, while other regions had their own local supply-and-demand pressures.
For employers, that means a national hiring strategy may miss the point. Recruiting difficulty should be evaluated by occupation, skill level, metro area, compensation band, and whether the role can be remote or hybrid. For job seekers, the same principle applies: the headline unemployment rate may say less about opportunity than the number of fresh postings, applicant volume, and hiring speed in a specific field.
What happens next
The next phase of labor market tightness metrics will depend on whether employers continue to slow hiring without increasing layoffs. If openings keep falling, hires stagnate, and quits remain subdued, the market could become more clearly employer-friendly. If layoffs rise or unemployment moves above its recent range, analysts will likely treat the cooling as more concerning.
For now, the evidence points to a restrained labor market rather than a distressed one. Employers are still posting and hiring, but with more selectivity. Workers are still employed at high levels, but many have less job-switching leverage than they did during the peak shortage period. The practical takeaway is simple: labor market tightness is no longer a one-number story, and the most reliable view comes from combining federal labor market indicators with sector-level and local workforce metrics.
