
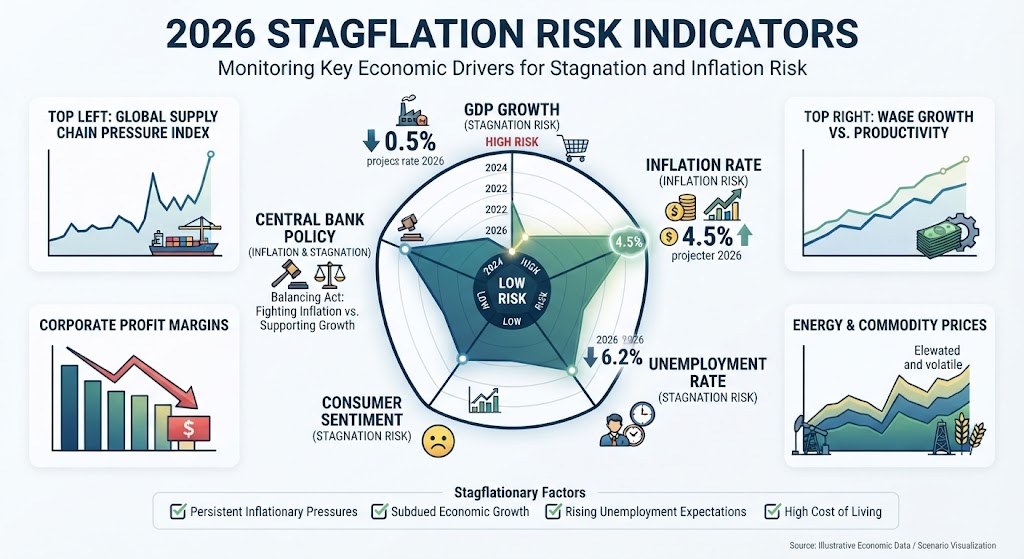
Stagflation risk indicators help investors, business leaders, and policy watchers spot the uncomfortable mix of weak growth, persistent inflation, and a softening labor market before it becomes obvious. They do not “predict” stagflation on their own, but they create a practical dashboard for reading whether inflationary pressures are staying high while the real economy loses momentum. In 2026, that dashboard matters because some U.S. data show elevated prices alongside areas of slowing growth and hiring, even as the economy has not clearly fallen into a classic stagflation pattern.
What do stagflation risk indicators actually measure?
Stagflation risk indicators measure whether inflation is proving sticky at the same time that growth, employment, productivity, or real household demand is weakening. The key is the combination: high inflation alone is not stagflation, and slow growth alone is not stagflation. The risk rises when price pressures remain broad or supply-driven while businesses and consumers show signs of fatigue.
A useful stagflation screen usually tracks three areas together:
- Inflation trend: headline CPI, core CPI, PCE inflation, wage growth, energy prices, and shelter costs.
- Growth trend: real GDP, real final sales, industrial activity, consumer spending, business investment, and productivity.
- Labor-market trend: payroll growth, unemployment, hours worked, job openings, layoffs, and labor-force participation.
The most important habit is to compare direction, not just level. A 3% inflation rate may be manageable if growth is accelerating and wages are healthy. The same inflation rate can become more concerning if GDP is slowing, hiring is cooling, and households are cutting discretionary spending.
The core stagflation signs to watch
The most reliable stagflation signs appear when multiple economic risk indicators move in the wrong direction together. A single hot inflation report or a single weak jobs report can be noise. A sustained pattern across prices, output, and labor is more meaningful.
Inflation stays above comfort levels
Persistent inflation is the first condition. In the U.S., the Federal Reserve’s longer-run inflation objective is 2%, and its July 2026 Monetary Policy Report said inflation had risen during the year and remained elevated relative to that objective, partly because of supply shocks including energy. That matters because supply-driven inflation can be harder to cool without also pressuring growth.
The August 2026 CPI report showed CPI-U up 3.4% over the prior 12 months, with energy up 16.3% and gasoline up 27.4%. Core inflation, excluding food and energy, was lower at 2.4% year over year, which suggests not every category was overheating equally.
Growth slows without fully collapsing
Stagflation is not always marked by a dramatic recession at first. Often, the more useful warning sign is a loss of economic speed: GDP still grows, but more slowly, and growth depends on fewer support pillars.
The BEA’s third estimate showed real U.S. GDP rose at a 2.2% annual rate in the second quarter of 2026, after 2.5% growth in the first quarter. That is not recessionary by itself, but it is the kind of data point that belongs in a stagflation dashboard when inflation remains elevated.
Hiring cools and unemployment edges higher
A cooling labor market can turn inflation into a broader household problem. If prices rise while job growth slows, consumers lose flexibility: they face higher bills but have less confidence in income growth.
The September 2026 Employment Situation report showed U.S. nonfarm payrolls increased by 29,000, while the unemployment rate rose to 4.2%. BLS also reported that July and August payroll gains were revised down by a combined 60,000 jobs.
Are current US economic indicators pointing to stagflation risk in 2026?
Current US economic indicators show stagflation risk in 2026, but not a definitive stagflation verdict. The concern comes from elevated inflation, energy-price pressure, and softer hiring; the counterpoint is that real GDP has still been growing and the labor market has not broken sharply. In other words, current economic indicators stagflation risk 2026 analysis should be framed as “watch closely,” not “declare a regime change.”
A balanced reading looks like this:
|
Indicator area |
What would raise risk |
What recent data suggest |
|---|---|---|
|
Inflation |
CPI and PCE remain above target, especially if broad-based |
CPI was 3.4% year over year in August 2026; energy was a major pressure point. |
|
Growth |
Real GDP slows toward stall speed or contracts |
Q2 real GDP grew 2.2% annualized, slower than Q1 but still positive. |
|
Labor market |
Payroll growth weakens and unemployment rises |
September payroll growth slowed to 29,000 and unemployment reached 4.2%. |
|
Policy backdrop |
Rates stay restrictive while inflation remains sticky |
The Fed held the federal funds target range at 3.50% to 3.75% in its July report context. |
For anyone monitoring current us economic indicators stagflation risk 2026, the nuance is essential. A risk signal is not the same as a confirmed outcome. The economy can move away from stagflation risk if energy prices stabilize, inflation expectations remain anchored, productivity improves, and hiring steadies.
Building a practical dashboard of risk assessment tools
The best risk assessment tools are simple enough to update regularly and broad enough to avoid overreacting to one report. A monthly dashboard can help separate a passing scare from a durable pattern.
Use these categories as a starting point:
- Headline and core inflation Track CPI and PCE together. Headline inflation captures the household pain of food and energy. Core measures help show whether inflationary pressures are spreading beyond volatile categories.
- Real growth and demand Watch real GDP, real consumer spending, and real final sales. If nominal spending looks healthy but inflation accounts for most of the increase, real demand may be weaker than it appears.
- Labor-market breadth Payroll gains are useful, but they are not enough. Add unemployment, hours worked, temporary-help employment, job openings, and continuing claims to see whether weakness is spreading.
- Input costs and supply shocks Energy, shipping, commodities, insurance, and imported goods can all create cost pressure. Stagflation risk rises when these costs increase while demand is no longer strong enough to absorb them easily.
- Expectations and financial conditions Inflation expectations, credit spreads, mortgage rates, and lending standards show whether households and businesses are preparing for tighter conditions. Expectations matter because they can influence wage demands, pricing decisions, and long-term contracts.
A simple checklist for reading stagflation risk indicators
A checklist keeps the analysis disciplined. Instead of asking whether the economy “feels bad,” ask whether several measurable signals are deteriorating together.
Higher-risk setup:
- Inflation remains above target for several months.
- Energy or food costs are driving headline inflation higher.
- Core inflation stops improving or reaccelerates.
- Real GDP slows for multiple quarters.
- Payroll growth weakens and unemployment trends upward.
- Real wages stagnate or fall.
- Consumer confidence and small-business sentiment decline.
- Credit becomes tighter for households or firms.
Lower-risk setup:
- Inflation decelerates across both headline and core measures.
- Energy shocks fade instead of spreading into other categories.
- GDP growth remains positive and broad-based.
- Productivity offsets some wage and input-cost pressure.
- Hiring slows gradually without a jump in layoffs.
- Inflation expectations remain stable.
This is where judgment matters. Stagflation is a macroeconomic pattern, not a single threshold. If three or four signals flash yellow, caution is reasonable. If most of them flash red at the same time, the risk assessment becomes more serious.
Why inflationary pressures can be misleading
Inflationary pressures do not all carry the same stagflation risk. Demand-driven inflation can occur when consumers and businesses are spending aggressively. Supply-driven inflation can happen when energy, trade, weather, conflict, or production constraints raise costs even as demand weakens.
That distinction changes the policy challenge. If demand is too strong, tighter monetary policy may cool inflation with a manageable slowdown. If supply shocks are the main driver, higher rates may do less to fix the source of inflation while still weighing on housing, investment, and hiring.
This is why analysts often look beyond the headline CPI number. They ask whether price increases are concentrated in energy and a few volatile categories, or whether they are spreading through services, wages, rents, and business input costs. Broadening inflation is usually a more serious stagflation sign than a temporary spike in one category.
Turning indicators into decisions
For businesses, stagflation risk indicators can guide planning without creating panic. A company may stress-test margins under higher input costs, review supplier concentration, protect cash flow, and avoid assuming that customers will accept repeated price increases. Leaders can also model slower demand, especially for discretionary products or services.
For households, the practical response is similar but personal: maintain emergency savings, be cautious with variable-rate debt, compare wage growth with real living costs, and avoid making long-term commitments based only on optimistic income assumptions.
For investors, the main lesson is diversification and humility. Stagflation can pressure both stocks and bonds, but the impact varies by sector, duration, pricing power, and policy response. A disciplined process beats a dramatic forecast.
The takeaway
Stagflation risk indicators are most useful when they are read as a dashboard, not a headline. The strongest warning signs combine sticky inflation, slowing real growth, weaker hiring, and tighter financial conditions. As of October 7, 2026, U.S. data show reasons to watch stagflation risk carefully, especially inflation and labor-market cooling, but the evidence is mixed rather than conclusive.
The practical move is to monitor the pattern: inflation breadth, real growth, employment momentum, and supply shocks. If those indicators worsen together, stagflation risk rises. If inflation cools while growth and hiring remain stable, the risk fades.
