
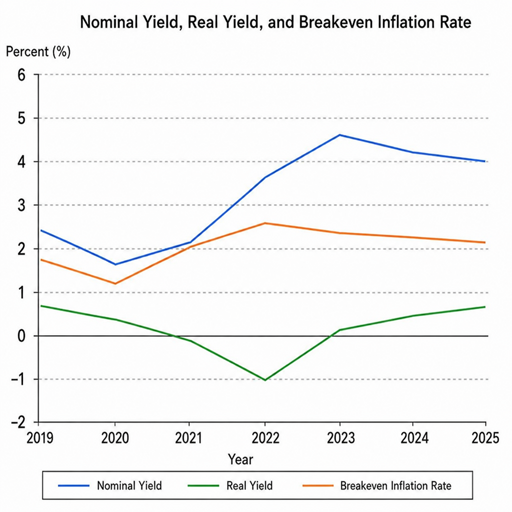
Inflation expectations breakevens are market-based measures of the average inflation rate investors appear to expect over a specific period. They are usually calculated by comparing the yield on a regular nominal government bond with the yield on an inflation-protected bond of the same maturity, giving investors, economists, and policymakers a practical way to interpret breakeven inflation expectations.
Put simply, an inflation breakeven rate is the inflation rate at which an investor would be indifferent between holding a nominal bond and an inflation-linked bond until maturity. If actual inflation is higher than the breakeven, the inflation-protected bond generally performs better; if actual inflation is lower, the nominal bond generally has the advantage.
What are inflation expectations breakevens?
Inflation expectations breakevens are the difference between nominal bond yields and real, inflation-protected bond yields over the same time horizon. In the United States, the most commonly referenced comparison is between nominal Treasury securities and Treasury Inflation-Protected Securities, often called TIPS. The result is known as a breakeven inflation rate because it represents the average inflation rate that would make the two investments roughly equivalent over that period.
The basic formula is straightforward:
Breakeven inflation rate = nominal Treasury yield − TIPS real yield
For example, if a 10-year nominal Treasury yield is 4.00% and a 10-year TIPS real yield is 1.70%, the 10-year breakeven inflation rate is 2.30%. That number suggests the market is pricing in average inflation of about 2.30% per year over the next 10 years, before accounting for important technical factors.
That last caveat matters. Breakevens are often discussed as inflation rate predictions, but they are not pure forecasts. They reflect expected inflation, inflation risk premiums, supply and demand for specific securities, liquidity conditions, investor positioning, and sometimes temporary market stress. A breakeven rate is best understood as a market-implied signal, not a guaranteed estimate of future inflation.
The core features of breakeven inflation rates
Breakeven inflation rates are useful because they turn bond market pricing into a readable inflation signal. Instead of relying only on surveys, economic models, or central bank projections, analysts can observe what investors are willing to pay for inflation protection in real time. That makes breakevens especially valuable when market expectations are shifting quickly.
Key defining characteristics include:
- They are market-based. Breakevens come from traded securities, so they reflect investor behavior rather than only stated opinions.
- They are maturity-specific. A 2-year breakeven reflects a different time horizon than a 5-year, 10-year, or 30-year breakeven.
- They compare nominal and real yields. The calculation depends on the yield gap between traditional bonds and inflation-linked bonds.
- They imply an average inflation rate. A 10-year breakeven is not a prediction for one year; it is an implied average over 10 years.
- They include more than expectations. Liquidity premiums, risk compensation, tax considerations, and market technicals can all influence the level.
- They move with new information. Energy prices, monetary policy signals, growth expectations, fiscal policy, and risk sentiment can all affect breakevens.
Because of these features, inflation expectations breakevens sit between economic data and investor psychology. They are grounded in prices, but those prices are shaped by both fundamentals and market conditions.
How do inflation breakeven rates work?
Inflation breakeven rates work by comparing two types of bonds that differ mainly in how they treat inflation. A nominal bond pays interest and principal in fixed dollars. An inflation-linked bond adjusts its principal or payments based on an inflation index, helping preserve purchasing power if inflation rises.
The nominal bond yield includes compensation for expected inflation because future fixed payments may be worth less in real terms. The inflation-protected bond yield is often described as a real yield because it is quoted after adjusting for inflation protection. Subtracting the real yield from the nominal yield gives the implied inflation compensation embedded in the market.
Consider the intuition. If investors worry that inflation will be high, they may demand more yield to own nominal bonds, or they may bid up the price of inflation-protected bonds. Either way, the gap between nominal yields and real yields can widen. A wider gap usually means higher breakeven inflation expectations.
If investors believe inflation will fall, or if demand for inflation protection weakens, breakevens may narrow. That narrowing can happen because nominal yields fall, real yields rise, or both. The direction and cause matter, so analysts rarely look at breakevens in isolation.
A basic interpretation looks like this:
|
Breakeven movement |
Common interpretation |
Important caution |
|---|---|---|
|
Breakevens rise |
Markets are pricing higher inflation compensation |
Could also reflect stronger demand for inflation protection |
|
Breakevens fall |
Markets are pricing lower inflation compensation |
Could also reflect poor liquidity or risk-off trading |
|
Short-term breakevens rise faster than long-term breakevens |
Near-term inflation pressure may be expected |
Energy prices can heavily influence short horizons |
|
Long-term breakevens stay stable |
Long-run inflation expectations may be anchored |
Stability does not prove inflation will match the implied rate |
This is why breakeven inflation expectations are often read alongside real yields, nominal yields, commodity prices, wage data, consumer surveys, and central bank communications.
Breakevens are not the same as inflation forecasts
Breakevens are sometimes treated like clean inflation rate predictions, but that is too simple. A forecast is an estimate of what inflation will actually be. A breakeven is a price-based measure of the inflation compensation investors require to hold one bond instead of another.
Several factors can pull breakevens away from expected inflation. Inflation-linked bonds may be less liquid than nominal government bonds, especially during periods of market stress. Investors may pay a premium for protection against unexpectedly high inflation, which can push breakevens above a simple forecast. At other times, technical demand from pension funds, asset managers, or hedging activity may affect pricing.
Shorter-term breakevens can also be sensitive to near-term price swings. Oil, gasoline, food, and other volatile components can influence inflation-linked securities because investors expect those changes to affect headline inflation. Longer-term breakevens tend to be used as a signal of whether investors believe inflation will remain controlled over time, but even those measures are not free of distortions.
A useful way to frame the distinction is this:
- Inflation forecasts ask, “What do economists or models expect inflation to be?”
- Inflation expectations breakevens ask, “What inflation compensation is currently priced into the bond market?”
- Survey expectations ask, “What do households, businesses, or professional forecasters say they expect?”
- Central bank targets show the inflation rate policymakers are trying to achieve over time.
Each measure has value. Breakevens are timely and market-based, forecasts can include broader analysis, surveys reveal sentiment, and central bank targets provide policy context. The strongest inflation analysis usually compares all of them rather than relying on one number.
Why breakeven inflation expectations matter
Breakeven inflation expectations matter because inflation affects interest rates, asset prices, wages, savings, borrowing costs, and purchasing power. When breakevens move, they can signal changing views about the economy and monetary policy. Investors watch them to understand whether markets are becoming more concerned about inflation or more confident that price pressures will fade.
For central banks, breakevens can help indicate whether long-term inflation expectations remain anchored. If long-term breakevens rise sharply and persistently, policymakers may worry that investors expect inflation to stay above target. If breakevens fall too low, the concern may shift toward weak demand, disinflation, or insufficient inflation.
For portfolio managers, breakevens help evaluate the relative appeal of nominal bonds versus inflation-linked bonds. If an investor expects actual inflation to exceed the market’s breakeven rate, inflation-linked bonds may look attractive. If the investor expects inflation to come in below the breakeven, nominal bonds may appear more appealing, all else equal.
For everyday readers, the concept is useful because it explains a widely cited market signal. When news reports say that inflation expectations are rising or falling, they may be referring to breakeven inflation expectations. Knowing what sits behind that phrase makes the signal easier to interpret and less likely to be misunderstood.
When are inflation breakevens most useful?
Inflation breakevens are most useful when they are used to compare market expectations across time horizons, track changes over time, or evaluate whether inflation-linked bonds look cheap or expensive relative to nominal bonds. They are less useful when treated as a single, precise prediction.
A 5-year breakeven, for instance, may help show how markets view medium-term inflation pressure. A 10-year breakeven may be more useful for assessing long-term inflation compensation. Some analysts also look at forward breakeven measures, such as expectations for a future five-year period, to separate near-term inflation noise from longer-term trends.
Practical uses include:
- Reading bond market sentiment. Rising breakevens can show that investors want more compensation for inflation risk.
- Comparing inflation views across maturities. A steep difference between short- and long-term breakevens can reveal whether inflation concerns are seen as temporary or persistent.
- Assessing real returns. Investors can compare nominal yields, real yields, and inflation expectations to judge the purchasing-power outlook.
- Evaluating inflation-linked bonds. If an investor’s inflation outlook is higher than the breakeven, inflation-linked bonds may be worth considering.
- Monitoring policy credibility. Stable long-term breakevens may suggest confidence that inflation will be managed over time.
- Stress-testing assumptions. Businesses and investors can compare their own inflation assumptions against market-implied pricing.
The key is to focus on direction, context, and persistence. A one-day move may not say much. A sustained change across several maturities is usually more meaningful.
Common misunderstandings about breakeven inflation expectations
Breakevens are powerful but easy to overstate. The most common mistake is assuming that the breakeven rate equals “what inflation will be.” It does not. It is the inflation rate implied by a specific bond market comparison, shaped by both expectations and premiums.
Another misunderstanding is assuming all breakevens say the same thing. A 2-year breakeven may be dominated by near-term inflation shocks, while a 30-year breakeven may reflect long-term policy credibility, demographics, productivity assumptions, and demand for long-duration assets. The maturity matters.
A third mistake is ignoring real yields. Sometimes breakevens rise because nominal yields increase. Other times they rise because real yields fall. Those two situations can imply different market stories, so looking only at the breakeven can hide the driver of the move.
Keep these cautions in mind:
- Breakevens are implied rates, not promises. Actual inflation can be higher or lower.
- Liquidity can distort pricing. Less-liquid securities may carry yields that do not perfectly reflect expectations.
- Risk premiums matter. Investors may pay extra for insurance against inflation surprises.
- Headline inflation can dominate short maturities. Energy and food swings may have an outsized near-term effect.
- Taxes and index mechanics can complicate returns. Real-world investor outcomes may differ from a simple yield comparison.
- Market stress can blur signals. During volatile periods, investors may sell what they can, not what they want to sell.
A good reading of breakevens is balanced: they deserve attention, but they should not be treated as a crystal ball.
A simple example of the breakeven decision
Imagine an investor comparing a nominal government bond with an inflation-linked bond of the same maturity. The nominal bond offers a fixed yield. The inflation-linked bond offers a lower real yield but adjusts for inflation. The investor’s choice depends partly on whether actual inflation is likely to come in above or below the breakeven.
If the breakeven inflation rate is 2.50% and the investor expects inflation to average 3.00%, the inflation-linked bond may be attractive because actual inflation would exceed what the market has priced. If the investor expects inflation to average 2.00%, the nominal bond may look better because the market is pricing more inflation than the investor expects. If actual inflation lands near 2.50%, the two choices may produce similar inflation-adjusted outcomes before fees, taxes, and trading effects.
This example is simplified, but it captures the core idea. Breakeven analysis is not only about predicting inflation; it is about comparing your inflation view with the inflation compensation already embedded in market prices.
Related terms that help clarify the concept
Inflation expectations breakevens are easier to understand when separated from nearby concepts. These terms often appear together, but they are not interchangeable.
- Nominal yield: The stated yield on a bond before adjusting for inflation.
- Real yield: The yield after accounting for inflation protection, commonly associated with inflation-linked bonds.
- Expected inflation: The inflation rate investors, households, businesses, or economists think may occur.
- Inflation risk premium: Extra compensation investors may require for the possibility that inflation is higher than expected.
- TIPS spread: Another common phrase for the yield difference between nominal Treasuries and TIPS.
- Forward breakeven rate: A market-implied inflation rate for a future period rather than from today to maturity.
These distinctions help prevent a common analytical error: treating every inflation-related number as if it measures the same thing. Breakevens are part of the inflation picture, not the whole picture.
How to interpret breakevens responsibly
The best way to interpret breakeven inflation expectations is to ask what changed, over what horizon, and alongside which other indicators. A rising 10-year breakeven during a period of strong growth may send a different message than a rising breakeven driven by a short-term energy shock. A falling breakeven during a liquidity squeeze may not mean investors suddenly expect very low inflation.
A practical checklist can help:
- Compare the breakeven with its own recent trend, not just one isolated reading.
- Look at several maturities to separate near-term and long-term inflation signals.
- Check whether nominal yields, real yields, or both are driving the move.
- Compare breakevens with survey-based expectations and economic forecasts.
- Consider market conditions, including liquidity and risk appetite.
- Avoid treating breakevens as investment advice without considering goals, time horizon, taxes, and risk tolerance.
Used this way, inflation breakeven rates become a disciplined tool rather than a headline number. They help translate bond prices into an inflation signal, while still leaving room for judgment.
The bottom line
Inflation expectations breakevens measure the inflation rate implied by the difference between nominal bond yields and inflation-protected bond yields. They are often used as a real-time gauge of market-based inflation expectations, but they also reflect risk premiums, liquidity, and supply-demand dynamics.
For investors, analysts, and curious readers, breakevens are most valuable when used as a comparison point. They show what inflation compensation is already priced into the market, helping you judge whether your own view of future inflation is higher, lower, or roughly in line with market pricing. That makes breakeven inflation expectations a practical starting point for understanding inflation risk, not a final answer on where inflation is headed.
