
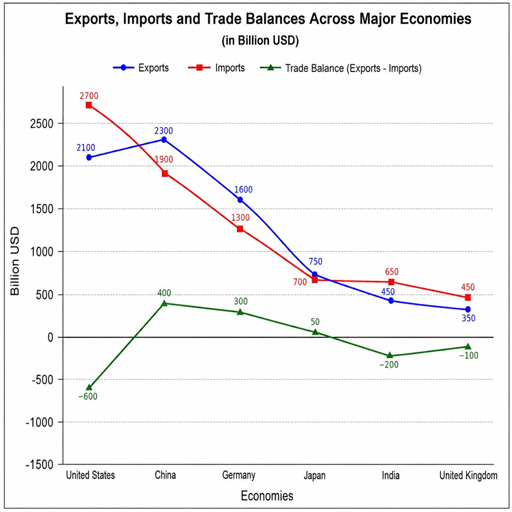
International trade balance reports released in September show a world economy still trading at high speed, but with sharper differences between goods, services, and major regions. The latest U.S. report showed a wider July deficit, while Eurostat reported a July goods surplus for the euro area and China reported strong year-to-date goods trade growth through August. For businesses, investors, and policymakers, the balance of trade is now less about a single headline deficit or surplus and more about what is driving the gap.
What changed in the latest trade balance reports?
The most recent U.S. international trade balance report showed that the goods and services deficit widened to $88.6 billion in July 2026, up $17.4 billion from a revised $71.2 billion in June. Exports fell to $310.7 billion, while imports rose to $399.3 billion, meaning the monthly international trade in goods and services balance moved deeper into deficit as import demand increased and exports softened.
The details matter. The U.S. goods deficit increased to $119.6 billion, while the services surplus edged up to $31.0 billion, showing how services continue to offset part of the goods gap without eliminating it. Year to date, however, the U.S. goods and services deficit was still down 29.6% from the same period in 2025, a reminder that one monthly report can move against a broader trend.
Key figures from recent international trade statistics
Recent international trade statistics point to a mixed but active trade environment across major economies. The balance of international trade is improving in some regions, narrowing in others, and being shaped by both real demand and price effects.
- United States: July 2026 goods and services deficit widened to $88.6 billion, with imports rising faster than exports during the month.
- Euro area: July 2026 goods trade with the rest of the world posted a €14.2 billion surplus, up from €10.7 billion in July 2025.
- European Union: Extra-EU goods trade recorded an €8.0 billion surplus in July 2026, compared with €9.8 billion a year earlier.
- China: Goods imports and exports rose 17.6% year over year in January-August 2026 to 34.78 trillion yuan, with exports up 14.6% and imports up 22.0%.
- G20: Merchandise trade accelerated in Q2 2026, with import growth at 6.7% quarter over quarter and export growth at 5.9% in current U.S. dollars.
U.S. deficit widened as capital goods imports climbed
The July U.S. report is notable because the deficit widened on both sides of the equation: exports declined while imports increased. Goods exports fell by $6.2 billion to $201.0 billion, led by a decline in industrial supplies and materials, including crude oil and nonmonetary gold. Services exports also slipped, with decreases in travel, financial services, and transport.
Imports moved the other way. Goods imports rose by $11.4 billion to $320.6 billion, with capital goods accounting for a major share of the increase. Computers, computer accessories, and semiconductors were specifically cited as import categories that rose in July, which links the trade numbers to business investment, technology demand, and supply-chain flows rather than consumer goods alone.
That distinction is important for interpreting the balance of payment in international trade. A wider deficit is often treated as a negative headline, but the underlying composition can point to very different economic stories. A rise in imported capital equipment may signal domestic investment, while falling exports in energy-related categories can reflect price movements, production patterns, or shifting external demand.
Europe’s goods balance improved in July, but year-to-date pressure remained
Eurostat’s latest July release showed a stronger monthly goods position for the euro area. Exports to the rest of the world reached €276.0 billion, up 9.0% from July 2025, while imports reached €261.8 billion, up 7.9%. That left a €14.2 billion euro area goods surplus for the month.
The European Union as a whole also recorded a monthly surplus, but the annual comparison was less favorable. Extra-EU exports were €247.1 billion in July 2026, while imports were €239.1 billion, producing an €8.0 billion surplus, smaller than the €9.8 billion surplus recorded in July 2025. For January through July, the EU recorded a €13.8 billion deficit, compared with an €84.0 billion surplus in the same period of 2025.
This split between the monthly figure and the year-to-date figure is exactly why analysts watch more than one international trade balance measure. A monthly surplus can indicate near-term improvement, but cumulative data may still show pressure from earlier months, energy costs, imported inputs, or changing product demand.
China’s trade expansion remained broad through August
China’s official data showed continued goods trade expansion through the first eight months of 2026. Total goods imports and exports rose to 34.78 trillion yuan, with import growth outpacing export growth over the January-August period. In August alone, goods trade totaled 4.65 trillion yuan, up 19.8% from a year earlier, and stayed above the 4-trillion-yuan mark for the sixth consecutive month.
For global trade-watchers, the import side is especially relevant. When a major manufacturing and consumption economy reports faster import growth, it can signal stronger demand for commodities, components, machinery, or consumer products. It can also narrow a goods surplus even when exports are still rising, showing again that the balance of trade is shaped by both sides of the ledger.
Global trade is growing, but price effects are clouding the signal
Broader international trade statistics suggest that global trade is expanding in value terms, though not all of that growth reflects higher physical volumes. UN Trade and Development reported that goods trade reached about US$13.7 trillion in the first half of 2026, up 12.5% from the same period in 2025, while services trade grew 10.5%. The agency also noted that higher prices for energy, transport, logistics, production, and selected commodities contributed to the increase.
The WTO’s September 2026 Goods Trade Barometer also pointed to resilient merchandise trade. Its latest reading of 102.0 was above the baseline value of 100 and slightly higher than its prior reading, indicating above-trend trade volumes despite geopolitical and policy-related uncertainties. The WTO noted that demand linked to electronic components and AI-related investment helped offset some pressure from Middle East conflict risks.
Goods and services tell different stories
The international trade in goods and services balance is broader than merchandise trade alone. Goods data capture physical products crossing borders, while services include categories such as travel, transport, financial services, intellectual property charges, business services, telecommunications, and information services. The U.S. release, for example, separates the goods deficit from the services surplus because those categories often move differently.
That separation is also central to the balance of payment international trade framework. Balance-of-payments accounting adjusts trade data so they fit into a country’s wider international accounts, including current-account analysis and national income reporting. In the U.S. methodology, Census goods data feed into BEA’s national accounts and international transactions accounts, with adjustments applied for coverage, valuation, timing, and other statistical reasons.
For readers comparing countries, the practical takeaway is simple: a goods-only balance of trade is not the same as the full international trade balance. A country can run a goods deficit and a services surplus at the same time, and the net result depends on the scale of both flows.
What happens next
The next major U.S. release, covering August 2026 international trade in goods and services, is scheduled for October 6, 2026. That report will show whether July’s wider deficit was a one-month adjustment or the start of a more persistent shift in the U.S. balance of international trade.
Until then, the latest reports point to three themes: demand for technology-linked goods remains important, services continue to cushion goods imbalances in some economies, and price changes are inflating parts of global trade value. For decision-makers, the headline balance of trade still matters, but the more useful reading comes from the details beneath it: what is being exported, what is being imported, and whether the movement reflects volume, prices, or both.