
GBP/USD technical analysis is the study of price behavior in the British pound versus the US dollar using charts, patterns, indicators, and market structure. Instead of guessing where the pair may go next, traders use repeatable tools to identify trend direction, key price levels, momentum shifts, and possible trade setups. This guide explains practical techniques for reading the pair with more structure, whether you are reviewing a long-term chart or doing gbp usd technical analysis today.
What does GBP/USD technical analysis actually show?
GBP/USD technical analysis shows how buyers and sellers have behaved over time, where price has reacted before, and where momentum may be changing. It does not predict the future with certainty, but it helps traders build a reasoned view of probability, risk, and timing. For anyone involved in gbp usd trading, the goal is not to be right on every move; it is to make better decisions with a clear plan.
The GBP/USD pair, often called “cable,” can move quickly because it reflects two major economies, two central banks, and shifting global risk sentiment. Technical analysis gives traders a way to organize that movement. A chart can reveal whether price is trending, ranging, breaking out, or losing momentum before a reversal.
A strong analysis usually combines several elements rather than relying on one signal. Support and resistance, trendlines, candlestick behavior, moving averages, and momentum indicators each answer a different question. Used together, they create a fuller picture of what price is doing and where a trade idea may become invalid.
The foundation is market structure
Market structure is the basic language of price action. Before adding indicators, traders often begin by identifying whether GBP/USD is making higher highs and higher lows, lower highs and lower lows, or moving sideways between a ceiling and a floor. This simple step prevents many common mistakes, such as buying into a clear downtrend just because an indicator looks temporarily oversold.
In an uptrend, buyers are repeatedly willing to enter at higher prices. Pullbacks may offer opportunities if they hold above previous swing lows. In a downtrend, sellers dominate rallies, and price often fails below previous swing highs. In a range, neither side has control for long, so traders may focus on reactions near support and resistance instead of expecting a clean directional move.
Market structure also helps with context. A bullish candlestick pattern at major support means more than the same pattern in the middle of a choppy range. Likewise, a breakout above resistance is more meaningful if it follows a series of higher lows, because that suggests demand has been building.
A practical structure check can include:
- Trend direction: Is price making higher highs, lower lows, or no clear sequence?
- Key swing points: Where did the last strong move begin or fail?
- Reaction zones: Which levels have produced repeated bounces, rejections, or consolidation?
- Invalidation area: At what price would the current idea no longer make sense?
- Momentum quality: Are moves expanding with strength or fading into smaller candles?
Support and resistance create the trading map
Support and resistance are among the most useful tools in GBP USD technical analysis because they show where traders previously made important decisions. Support is an area where buying has been strong enough to slow or reverse a decline. Resistance is an area where selling has been strong enough to limit or reverse an advance.
These levels should be treated as zones, not perfect lines. GBP/USD can briefly pierce a level, trigger stops, and then move back inside the prior range. By marking zones around repeated reactions rather than relying on a single exact price, traders give their analysis room to reflect real market behavior.
Support and resistance are especially helpful when building a gbp usd forecast. If price is approaching a major resistance area after a strong rally, the forecast may consider whether momentum is still healthy or whether profit-taking could appear. If price is testing support after a steep drop, the analysis may focus on whether sellers are still in control or whether exhaustion is visible.
Old support can become new resistance, and old resistance can become new support. This role reversal is common after breakouts. A breakout followed by a retest can offer a cleaner setup than chasing the first move, because the retest shows whether the market accepts the new price area.
Trendlines and channels clarify direction
Trendlines connect meaningful swing lows in an uptrend or swing highs in a downtrend. They help traders see the angle of a move and whether price is respecting a directional path. A trendline is not magic; it is a visual tool for organizing market behavior.
A rising trendline on GBP/USD suggests buyers continue stepping in on dips. If price repeatedly touches the line and bounces, the trendline becomes more relevant. If price breaks below it with momentum, traders may interpret that as a warning that the uptrend is weakening, especially if the break also violates a prior swing low.
Channels add another layer by drawing a parallel line on the other side of price. In an upward channel, the lower boundary may act as dynamic support, while the upper boundary may show where rallies become stretched. In a downward channel, traders may watch the upper boundary for selling pressure and the lower boundary for possible profit-taking.
The mistake to avoid is forcing a trendline onto a chart that does not respect it. A valid line should connect obvious swing points and help explain current price action. If a line needs constant adjustment to remain relevant, the market may simply be too messy for that tool at the moment.
Which indicators are useful for gbp usd trading?
The most useful indicators for gbp usd trading are the ones that answer a specific question without cluttering the chart. Moving averages can clarify trend direction, RSI can highlight momentum conditions, MACD can show shifts in trend strength, and ATR can help estimate volatility. None of them should replace price action, but each can support a better trade plan.
Moving averages
Moving averages smooth price data and make trend direction easier to read. A short-term moving average above a longer-term moving average often suggests upward momentum, while the opposite can suggest downward pressure. Traders may also watch how price behaves around a commonly followed average: does it bounce, slice through, or consolidate around it?
Moving averages work best in trending conditions. In choppy markets, price can cross back and forth repeatedly, producing weak signals. That is why many traders combine moving averages with support, resistance, and broader market structure before making decisions.
RSI and momentum readings
The Relative Strength Index, or RSI, helps traders judge whether momentum is stretched or fading. A high RSI does not automatically mean GBP/USD must fall, and a low RSI does not automatically mean it must rise. Strong trends can remain overbought or oversold for longer than expected.
The more useful signal is often divergence. If GBP/USD makes a new high while RSI makes a lower high, upside momentum may be weakening. If price makes a new low while RSI makes a higher low, downside pressure may be fading. Divergence is not a trade by itself, but it can warn traders to look more closely at price behavior.
MACD and trend shifts
MACD is often used to identify changes in momentum and trend strength. Crossovers can suggest that momentum is turning, while the histogram can show whether that momentum is increasing or decreasing. Like RSI, MACD becomes more useful when it agrees with market structure rather than contradicting it.
For example, a bullish MACD crossover near a well-tested support zone may deserve attention. The same crossover in the middle of a noisy range may be less meaningful. Context gives the indicator its practical value.
Timeframes change the meaning of a signal
A signal on the five-minute chart does not carry the same weight as a signal on the daily chart. Shorter timeframes provide more entries but also more noise. Higher timeframes provide stronger context but fewer opportunities.
Many traders use multiple timeframe analysis. They may begin with the daily chart to identify major trend direction, move to the four-hour chart to refine support and resistance, and use a one-hour or lower chart for timing. This approach helps prevent trades that look attractive on a small chart but conflict with the larger trend.
For daily technical analysis gbp usd, the daily candle is especially important because it summarizes a full session of buying and selling. A strong daily close above resistance can carry more weight than an intraday spike that quickly reverses. Similarly, a daily rejection at a major level can reshape short-term expectations.
A simple multiple-timeframe process:
- Start high: Identify the dominant trend and major zones on the daily chart.
- Move lower: Use the four-hour chart to find cleaner structure and recent swings.
- Plan the entry: Use a lower timeframe only after the broader setup is clear.
- Define risk: Place invalidation beyond a logical technical level, not randomly.
- Review the close: Give special attention to how candles close, not just where they trade intraday.
Candlestick patterns show behavior, not guarantees
Candlesticks are useful because they reveal how price moved during a period, not just where it ended. A long wick at support can show that sellers pushed price lower but failed to keep it there. A large bearish candle through support can show decisive selling pressure.
Common patterns include pin bars, engulfing candles, inside bars, and doji candles. A bullish engulfing candle at support may suggest buyers are taking control. An inside bar after a strong move may signal compression before another move. A doji near resistance may show indecision after a rally.
The key is location. A reversal candle at a major level is more meaningful than the same candle in the middle of nowhere. Traders should also consider what happened before the pattern. A bullish signal after a long decline may suggest a correction, while a bullish signal within an established uptrend may suggest continuation.
Breakouts, fakeouts, and retests matter
GBP/USD often attracts breakout traders because the pair can move sharply when price clears an important level. A breakout occurs when price moves beyond support or resistance with enough force to suggest a new phase may be starting. However, not every breakout holds.
A fakeout happens when price briefly breaks a level and then quickly reverses. This can trap traders who entered too late or placed stops too tightly. Fakeouts are common around obvious levels because many orders cluster there.
Retests help separate stronger breakouts from weaker ones. After price breaks resistance, it may return to test that area as support. If buyers defend the zone, the breakout gains credibility. If price falls back below the level, the breakout may have failed.
Useful breakout checks include:
- Did price close beyond the level, or only spike through it?
- Was the breakout candle strong, or did it leave a large rejection wick?
- Is the move aligned with the higher-timeframe trend?
- Did price retest the level and hold?
- Is there enough space before the next support or resistance zone?
How should traders approach a GBP/USD forecast?
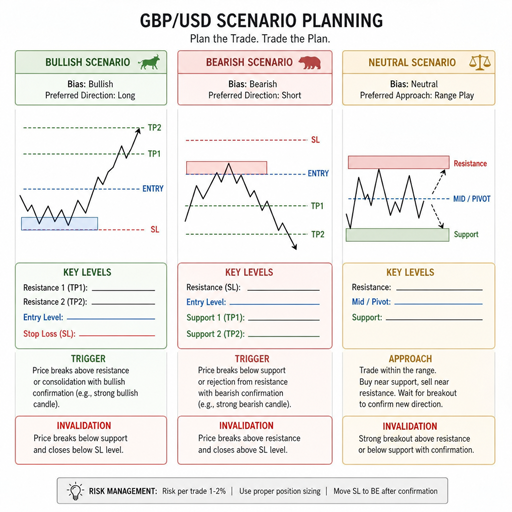
A GBP/USD forecast should be built as a scenario plan, not a fixed prediction. The best analysis usually says, “If price holds above this level, the bullish case remains stronger; if it breaks below that level, the bearish case gains weight.” This keeps the trader flexible when conditions change.
That distinction matters for gbp usd predictions. A prediction can sound confident but still fail if the market reacts to new information or shifts in sentiment. A scenario-based forecast gives traders a framework for adapting instead of clinging to one view.
A practical forecast might include a bullish scenario, a bearish scenario, and a neutral scenario. The bullish case may depend on price holding above a support zone and breaking a recent high. The bearish case may require a failed rally and a close below support. The neutral case may apply while price remains trapped between two major levels.
When creating a gbp usd forecast, avoid overloading the chart with too many signals. Choose the most relevant levels, identify the dominant structure, and decide what would confirm or invalidate each scenario. The clearer the plan, the easier it is to act calmly.
Seasonal keywords need careful handling
Search phrases such as gbp usd technical analysis october 2025 can attract readers looking for time-specific commentary. If you are writing or reading that kind of analysis, it is important to separate historical review from live market guidance. A technical setup from October 2025 may be useful as a case study, but it should not be treated as current trading direction unless the chart still supports it.
The same applies to gbp usd technical analysis today. “Today” changes constantly, so any live analysis should be based on current charts, current levels, and fresh market context. A timeless educational article can explain the process, but it should not pretend to know the latest price action without an updated chart review.
For SEO, these keywords can be used naturally when discussing how traders search for analysis. For trading decisions, however, the reader should always check the live chart, confirm the timeframe, and review upcoming economic events before acting.
Risk management turns analysis into a plan
Technical analysis is incomplete without risk management. A clean chart setup can still fail, and a weak-looking setup can sometimes work. Because outcomes are uncertain, traders need rules for position sizing, stop placement, and when to stay out.
A stop-loss should usually be placed where the trade idea is invalidated, not where the loss simply feels comfortable. If buying near support, for example, the invalidation point may be below the support zone or below the most recent swing low. If selling near resistance, the invalidation point may be above that resistance or above a failed breakout level.
Position size should reflect the distance to the stop. A wider stop requires a smaller position if the trader wants to keep risk consistent. This is where many beginners struggle: they focus on the entry but ignore whether the trade structure makes sense from a risk-to-reward perspective.
A useful pre-trade checklist:
- Trend: Does the trade align with the higher-timeframe direction?
- Level: Is the entry near a meaningful support, resistance, trendline, or retest?
- Trigger: What specific price action confirms the setup?
- Invalidation: Where is the trade idea clearly wrong?
- Reward: Is there enough room before the next major level?
- Timing: Are there major scheduled events that could increase volatility?
- Discipline: Will you follow the plan if price moves against you?
Common mistakes in GBP/USD technical analysis
One common mistake is using too many indicators. A crowded chart can create conflicting signals and make decision-making harder. It is usually better to understand a few tools deeply than to stack many tools without a clear purpose.
Another mistake is ignoring the higher timeframe. A trader may see a bullish pattern on a short-term chart while the daily chart is still in a strong downtrend. That does not mean the short-term trade cannot work, but it does mean the trader should understand they may be trading against broader pressure.
A third mistake is treating analysis as certainty. GBP/USD can react sharply to unexpected headlines, central bank comments, or changes in risk appetite. Technical levels can help identify likely reaction zones, but they cannot remove uncertainty.
Finally, many traders enter before confirmation. They anticipate a breakout, reversal, or retest before price has actually shown enough evidence. Waiting for confirmation may mean missing some moves, but it can also reduce impulsive trades.
A repeatable routine improves consistency
The value of GBP USD technical analysis increases when it becomes a repeatable process. Instead of opening a chart and reacting emotionally, traders can follow the same sequence each time. This makes it easier to compare setups, review decisions, and improve over time.
A simple routine might begin with the daily chart, then move down to intraday timeframes. The trader marks major support and resistance, identifies the trend, checks momentum, and writes down possible scenarios. Only then do they look for an entry trigger.
Keeping a journal can also help. Record the reason for the trade, the chart context, the entry, the stop, the target, and the outcome. Over time, patterns become visible. You may discover that you perform better with trend continuation trades than reversals, or that your best trades occur after retests rather than initial breakouts.
Final takeaway
GBP/USD technical analysis is most useful when it combines structure, levels, momentum, and risk management into one clear decision-making process. Support and resistance show where price has reacted, trend tools clarify direction, indicators add confirmation, and candlesticks reveal behavior at important moments.
For gbp usd trading, the aim is not to create perfect gbp usd predictions. The aim is to build flexible scenarios, manage risk, and respond to what the chart actually does. Whether you are reviewing a historical setup, preparing a daily outlook, or checking GBP/USD technical analysis today, a disciplined process will serve you better than any single signal.