
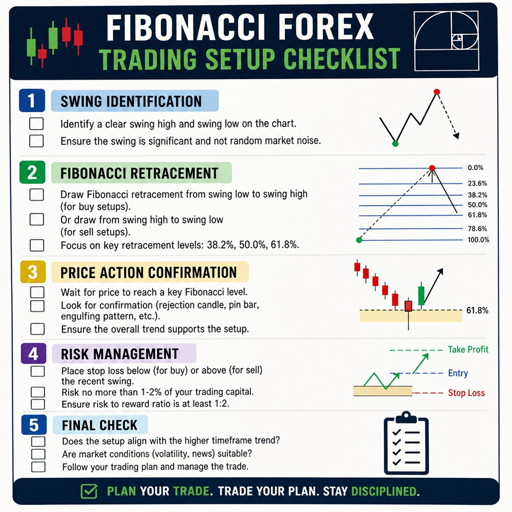
Fibonacci retracement in forex is a technical analysis method used to map likely pullback zones inside a broader trend. Traders use it to plan entries, manage risk, and build trading signals around price action instead of reacting emotionally to every candle. This guide explains how Fibonacci retracement forex setups work, where they fit among forex strategies, and how to combine them with other forex indicators without overcomplicating your chart.
What is Fibonacci retracement in forex?
Fibonacci retracement in forex is a charting tool that marks possible support or resistance levels after a strong price move. The trader selects a swing low and swing high in an uptrend, or a swing high and swing low in a downtrend, and the tool plots percentage retracement levels between those points. These levels are not predictions; they are areas where traders watch for a reaction.
The most commonly watched retracement levels are 38.2%, 50%, and 61.8%. Many platforms also include 23.6% and 78.6%. In practical forex trading, the exact number matters less than the context around it: trend direction, market structure, momentum, nearby support or resistance, and how price behaves when it reaches the zone.
A Fibonacci level becomes useful when it helps answer a trading question: “If the trend is still healthy, where might price pull back before continuing?” That is why it works best as part of a setup, not as a standalone signal.
The logic behind Fibonacci pullback setups
A trending market rarely moves in a straight line. It pushes, pauses, retraces, and then either continues or reverses. Fibonacci retracement gives structure to that pullback phase by highlighting zones where buyers or sellers may step back in.
In an uptrend, traders often look for price to pull back into a Fibonacci zone before considering a long trade. In a downtrend, they look for price to rally into a Fibonacci zone before considering a short trade. The idea is to avoid chasing the move after it has already stretched and instead wait for a better risk-to-reward area.
This approach fits naturally with price action. A bullish rejection candle at a 61.8% retracement, for example, may carry more meaning if it appears at prior support and the broader trend is still making higher highs and higher lows. A bearish rejection from the 50% level may be more convincing if it aligns with a broken support level now acting as resistance.
How do you draw Fibonacci retracement correctly?
To draw Fibonacci retracement correctly, anchor the tool to the most relevant swing points of the move you want to analyze. In an uptrend, draw from the swing low to the swing high. In a downtrend, draw from the swing high to the swing low. The cleaner and more obvious the swing, the more useful the levels tend to be.
The biggest mistake is forcing the tool onto every minor fluctuation. If the market is choppy, overlapping, or moving sideways, Fibonacci levels can become clutter rather than guidance. Focus on visible impulse moves where price clearly traveled from one area to another before pulling back.
Use this basic drawing process:
- Identify the trend first. Look for higher highs and higher lows in an uptrend, or lower highs and lower lows in a downtrend.
- Find the latest clean impulse move. Choose a move that stands out on your trading timeframe.
- Place the Fibonacci tool on the full swing. Use wick-to-wick or body-to-body consistently; do not switch methods to make a level fit.
- Mark confluence areas. Note where Fibonacci levels overlap with support, resistance, trendlines, moving averages, or round numbers.
- Wait for price action. Do not enter simply because price touches a level. Look for confirmation that buyers or sellers are responding.
Consistency matters. Two traders may draw slightly different Fibonacci levels, but a disciplined trader applies the same method repeatedly and evaluates whether it supports a clear plan.
Core Fibonacci retracement forex setups
Fibonacci works best when it is attached to a repeatable setup. Below are several practical ways traders use it within broader forex strategies.
Trend continuation pullback
This is the classic Fibonacci retracement forex setup. The market forms a strong impulse in the direction of the trend, then pulls back toward the 38.2%, 50%, or 61.8% area. The trader watches for signs that the pullback is losing strength and the original trend may resume.
In an uptrend, that confirmation might be a bullish engulfing candle, a pin bar rejecting support, or a smaller higher low forming inside the retracement zone. In a downtrend, it might be a bearish rejection candle or a lower high forming near a Fibonacci level.
This setup is popular because it gives the trader a logical invalidation point. If buying a pullback in an uptrend, a stop may sit below the swing low or below the structure that supported the entry. If selling a pullback in a downtrend, risk can often be defined above the recent swing high.
Breakout retest with Fibonacci confluence
After price breaks a major support or resistance level, it often comes back to retest the area. Fibonacci can help evaluate whether that retest also sits within a normal retracement zone.
For example, if EUR/USD breaks above resistance and then pulls back to that same level, a 50% or 61.8% retracement overlapping the retest area may create a stronger case for a continuation setup. The Fibonacci level is not the reason for the trade by itself; it adds confluence to a level that already matters.
This setup is especially useful for traders who dislike entering breakouts immediately. Waiting for the retest can reduce the feeling of chasing and provide a clearer place to define risk.
Fibonacci plus trendline reaction
A trendline can help show the rhythm of a move. When a Fibonacci retracement level aligns with a rising trendline in an uptrend or a falling trendline in a downtrend, the zone becomes more interesting.
The key is not to draw a trendline just to match the Fibonacci level. Start with market structure, draw the trendline only if it connects meaningful swings, then check whether a retracement level overlaps. If price reaches that area and shows rejection, the setup may become actionable.
Deeper retracement reversal watch
A deep pullback into the 61.8% or 78.6% area can sometimes mark the final test before trend continuation. It can also warn that the trend is weakening. The difference often comes down to price action and structure.
If price reaches a deep retracement and immediately rejects it with strong momentum, continuation may still be valid. If price grinds through the level, breaks structure, and fails to reclaim it, the setup may no longer support the original trend idea. This is where discipline protects traders from treating every Fibonacci level as a guaranteed turning point.
Building trading signals around Fibonacci
A trading signal should combine location, confirmation, and risk. Fibonacci provides location. Price action and other forex indicators can provide confirmation. Risk management determines whether the trade is worth taking.
A simple Fibonacci signal framework might look like this:
- Market condition: The pair is trending, not ranging.
- Impulse move: A clean bullish or bearish leg is visible.
- Retracement zone: Price pulls back into the 38.2% to 61.8% area.
- Confluence: The level overlaps with support, resistance, a trendline, or a moving average.
- Confirmation: Price prints a rejection candle, break of minor structure, or momentum shift.
- Risk plan: Stop-loss, target, and position size are defined before entry.
This framework helps prevent random entries. It also makes review easier because each trade can be judged against specific criteria rather than hindsight.
Which forex indicators pair well with Fibonacci?
The best forex indicators to pair with Fibonacci are the ones that clarify trend, momentum, or volatility without duplicating the same information. Fibonacci already identifies potential retracement zones, so the supporting indicator should answer a different question: Is momentum shifting? Is the trend intact? Is there enough room for the trade to develop?
Moving averages can help define trend direction. If price is above a rising moving average, long Fibonacci pullback setups may deserve more attention. If price is below a falling moving average, short setups may be cleaner.
Momentum indicators such as RSI or MACD can help show whether a pullback is losing force. For example, if price pulls back to a Fibonacci zone but bearish momentum fades, a trader may watch for a bullish price action trigger. These indicators should not be treated as automatic entry tools; they are filters.
Average True Range, or ATR, can help with stop placement by showing typical volatility. A stop that is too tight may get hit by normal market noise, while a stop that is too wide may weaken the trade’s risk-to-reward profile.
Price action confirms or cancels the setup
Fibonacci levels are zones of interest, not commands to trade. Price action determines whether the market is actually responding.
Useful confirmation may include:
- Rejection candles: Long wicks showing failed movement beyond the zone.
- Engulfing candles: Strong candles that reverse the prior pullback pressure.
- Micro structure shift: A lower timeframe break in the direction of the main trend.
- Higher low or lower high: A sign that the pullback may be ending.
- Failed breakout: Price briefly pierces a level, then closes back inside the expected zone.
A lack of confirmation is also information. If price slices through a Fibonacci level without hesitation, there is usually no reason to force the trade. The best setups often feel obvious because multiple pieces of evidence point in the same direction.
Risk management keeps the strategy usable
Even a well-drawn Fibonacci setup can fail. Forex trading involves uncertainty, and no technical analysis tool removes that. Risk management is what allows a trader to survive losing trades and keep decisions consistent.
Before entering, define where the setup is invalid. In a long trade, that may be below the swing low or below the reaction zone. In a short trade, it may be above the swing high or above resistance. The stop should be based on market structure, not on how much the trader hopes to risk.
Targets can be planned in several ways. Some traders aim for the prior swing high or low. Others scale out at nearby structure and leave part of the position for continuation. A more advanced approach is to use Fibonacci extensions after the retracement setup triggers, but the trade should still have a realistic target before entry.
Common mistakes to avoid
Fibonacci is simple to draw, which makes it easy to misuse. The tool becomes more reliable when traders avoid the most common errors.
- Trading every level: Not every retracement is a setup. Wait for trend, confluence, and confirmation.
- Ignoring higher timeframes: A buy setup on a small timeframe may run directly into major resistance on a larger one.
- Redrawing after the fact: Moving anchors to justify an entry destroys consistency.
- Using Fibonacci in messy ranges: Sideways price action can produce many false reactions.
- Skipping the stop-loss plan: A level without risk control is not a strategy.
- Overloading the chart: Too many indicators can make decisions slower and less objective.
The goal is not to make Fibonacci perfect. The goal is to make it part of a process that can be repeated, reviewed, and improved.
A practical setup checklist
Use this checklist before taking a Fibonacci retracement trade:
- Is the market clearly trending on the chosen timeframe?
- Is the swing used for the Fibonacci tool obvious and recent?
- Has price pulled back into a meaningful retracement zone?
- Does the zone align with support, resistance, trendline, or another useful factor?
- Has price action confirmed a reaction?
- Is the stop-loss placed where the setup is truly invalid?
- Does the potential reward justify the risk?
- Is there major news or unusual volatility that could disrupt the setup?
If several answers are unclear, the trade may not be ready. Patience is part of the edge.
Turning Fibonacci into a repeatable forex strategy
Fibonacci retracement is most useful when it helps traders wait for better entries within a structured plan. It can identify pullback zones, improve trade timing, and support clearer trading signals when combined with price action and sensible forex indicators.
The strongest Fibonacci retracement forex setups usually share the same traits: a clear trend, a clean impulse move, a pullback into a logical zone, visible confluence, and confirmation before entry. Use the tool to create structure, not certainty. When paired with disciplined risk management, Fibonacci can become a practical part of a broader forex trading approach rather than just another drawing on the chart.